Introduction to working with real data
Overview
Teaching: 15 min
Exercises: 20 minQuestions
How do I extract data from real data
Objectives
Extracting data from multidimensional data
Saving the data for external processing
Introduction
In this section, we will look at loading in data from an MRI scan of a human head.
Opening and viewing the file
- Click on File then Open.
- Navigation to the acenet-paraview-examples/ directory.
- Select the file mri-scan.pvd, then click OK.
- Click Apply in the Properties tab.
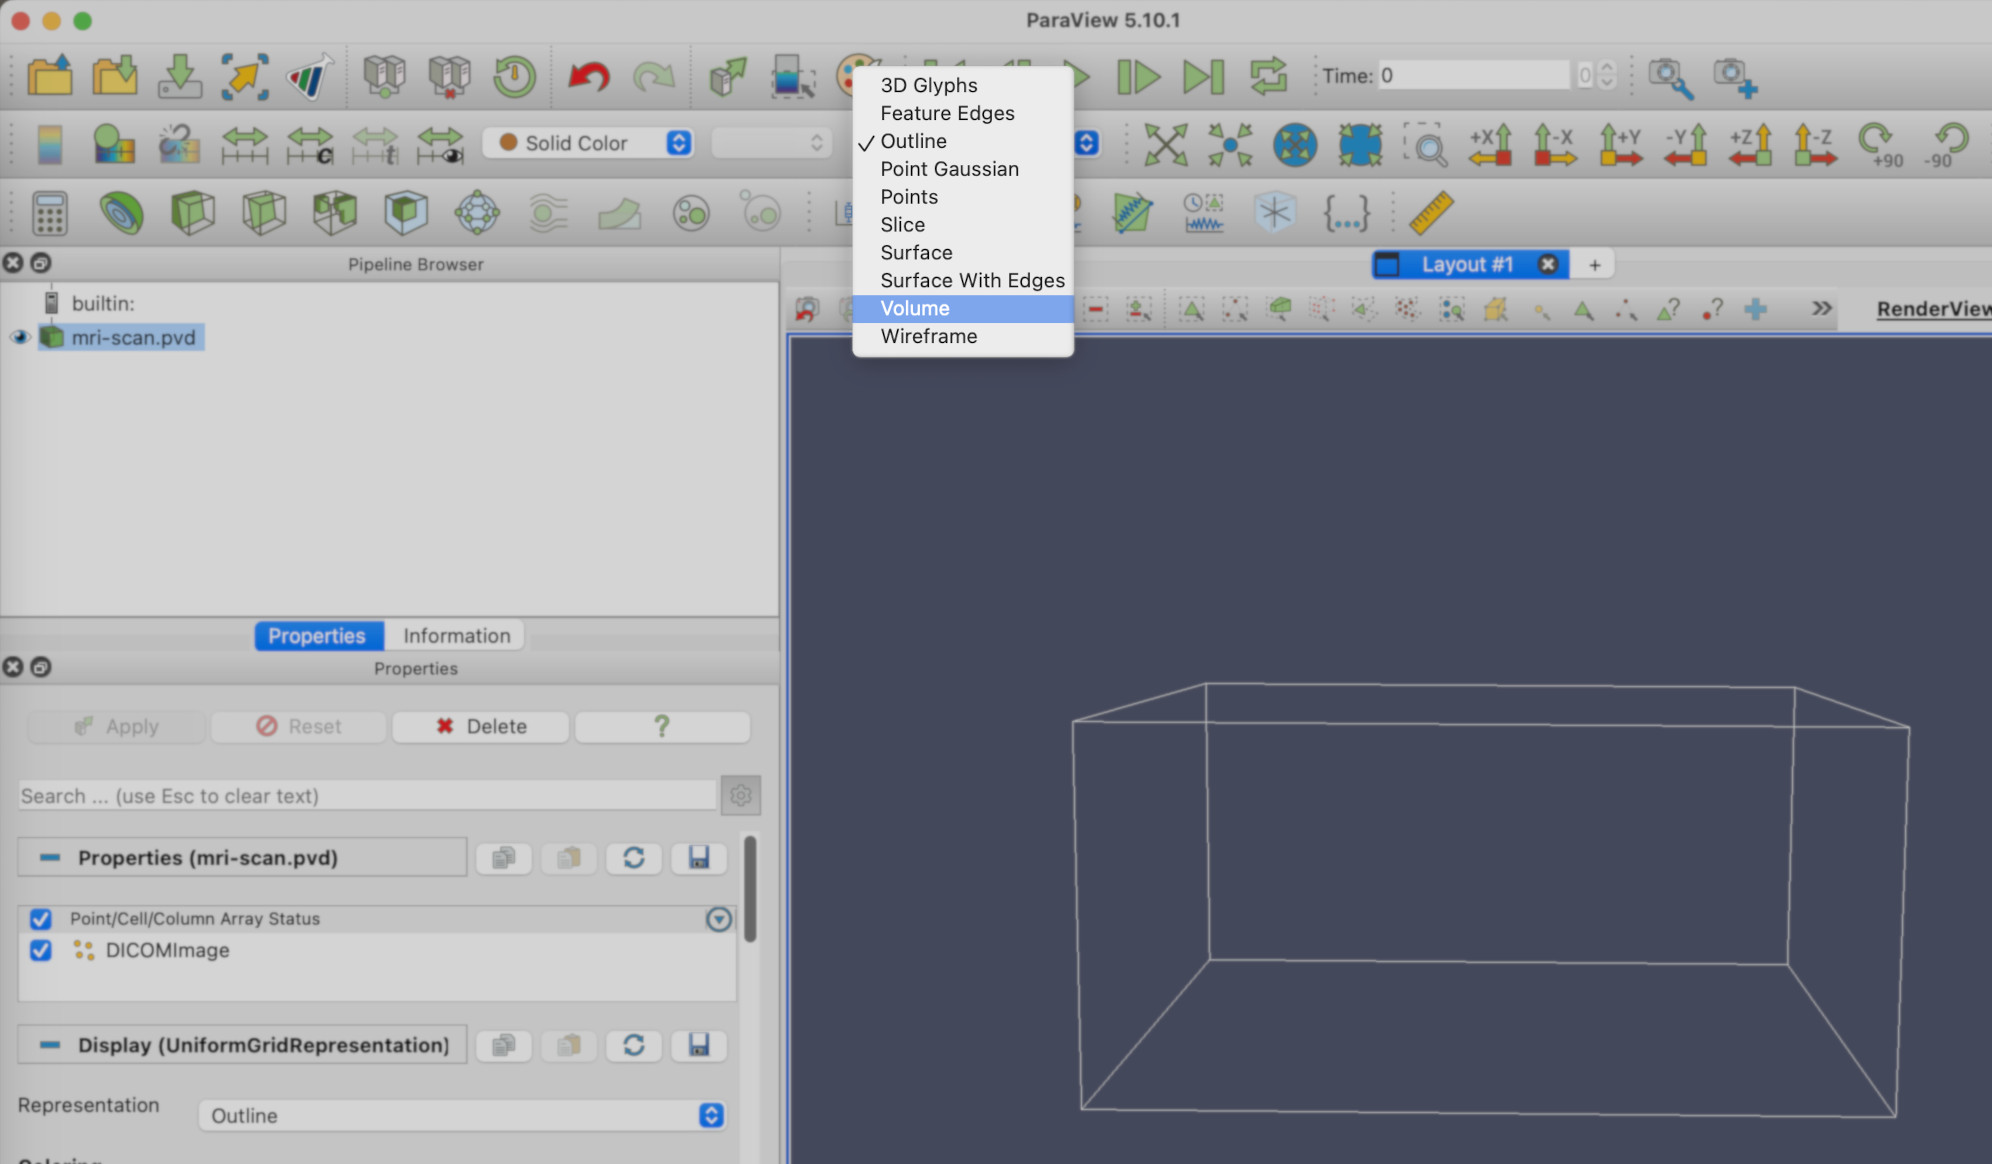
You should see a wireframe box. We’ll need to change the rendering to Volume. In the toolbar, you’ll see a drop-down menu that currently says Outline. Select Volume from this menu.
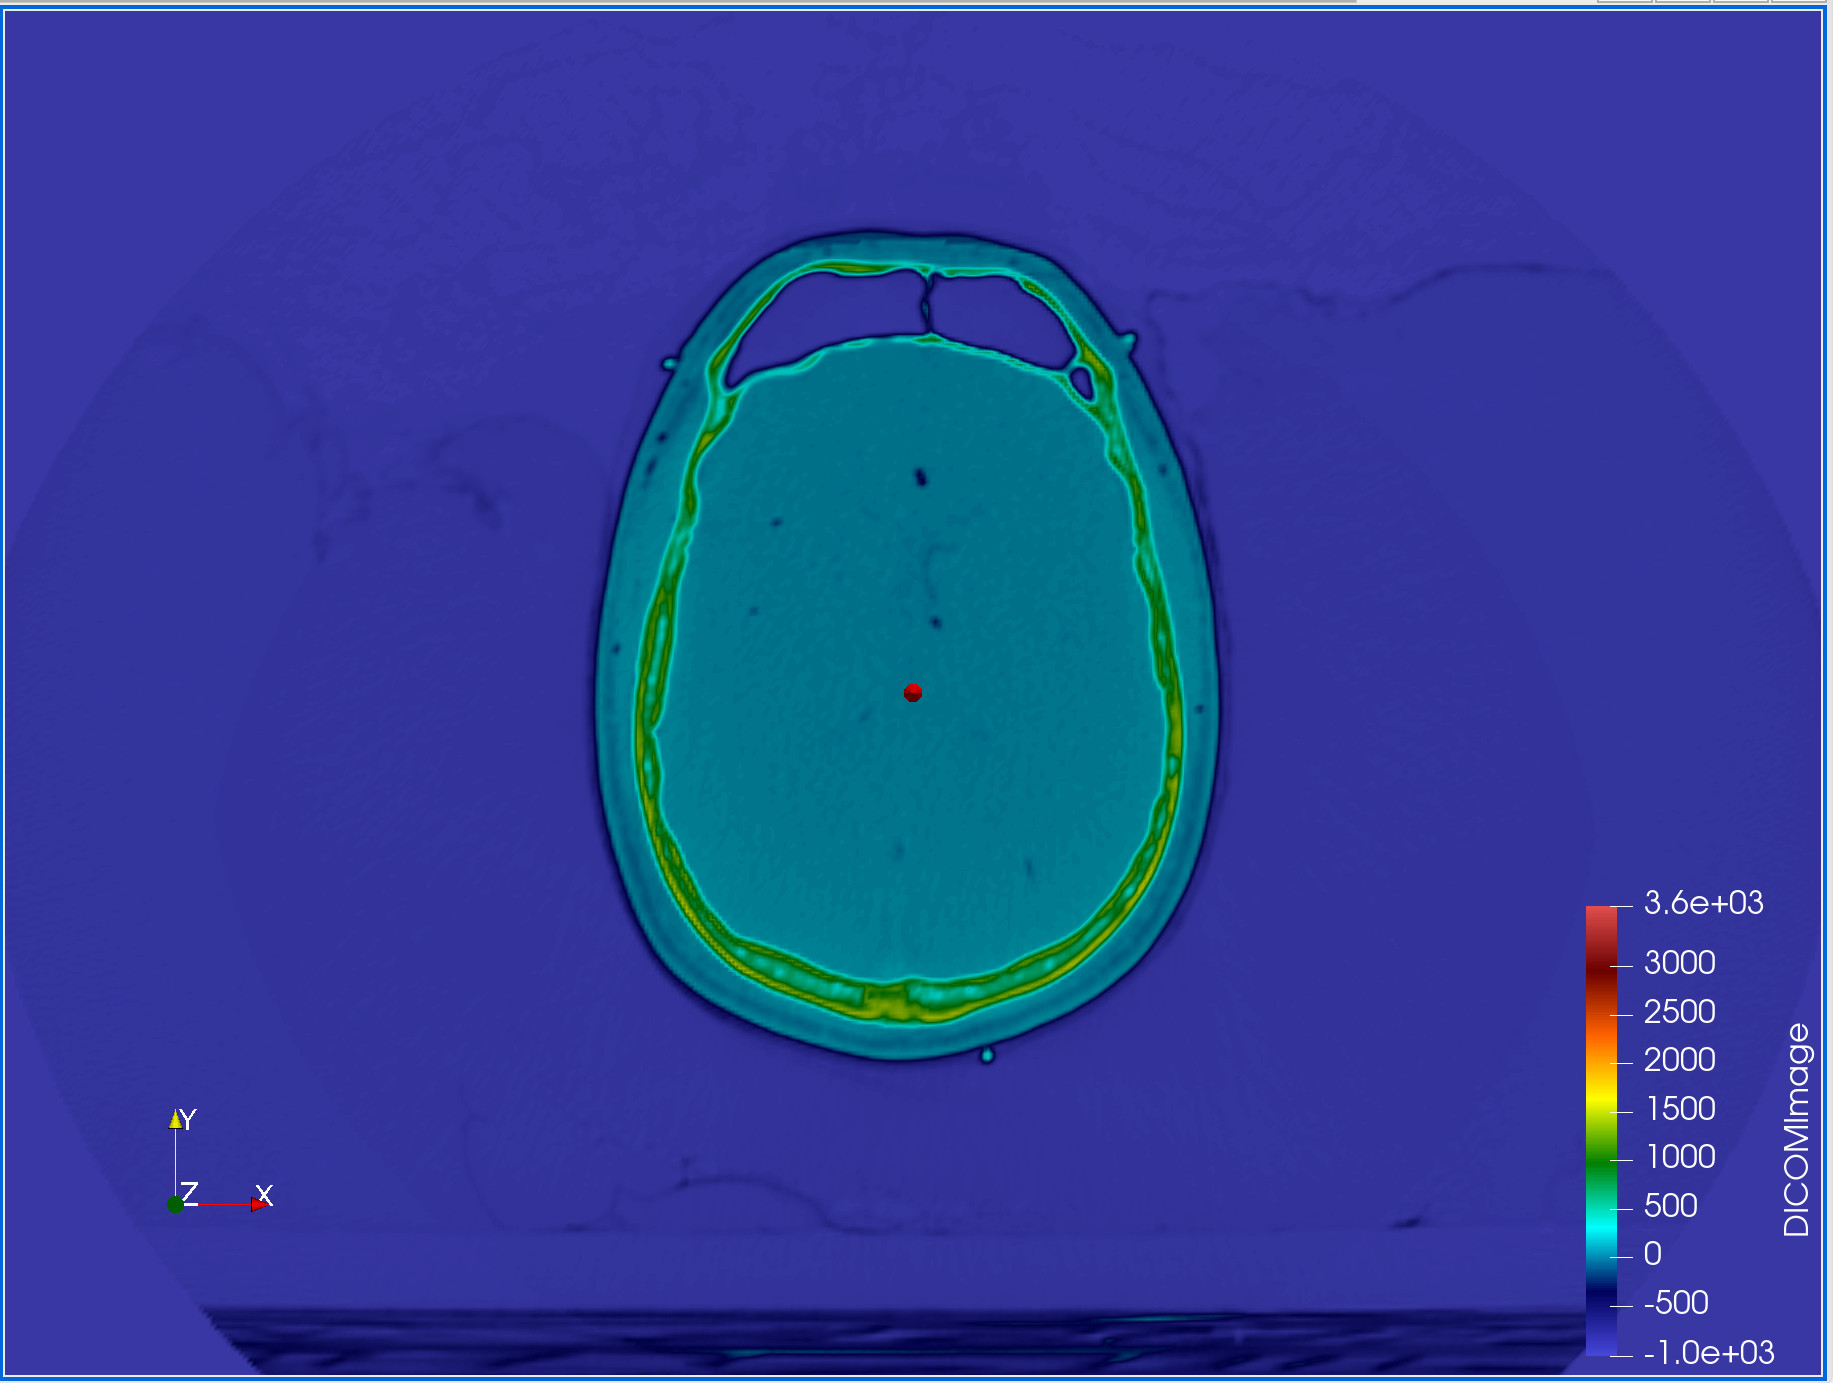
Zooming in a bit, you should have a view of the head clearly. Changing the colormap to Rainbow Desaturated (See the ‘Introducing filters’ episode, under Changing the colormap), and turning on the colormap legend, you should see something similar to this.
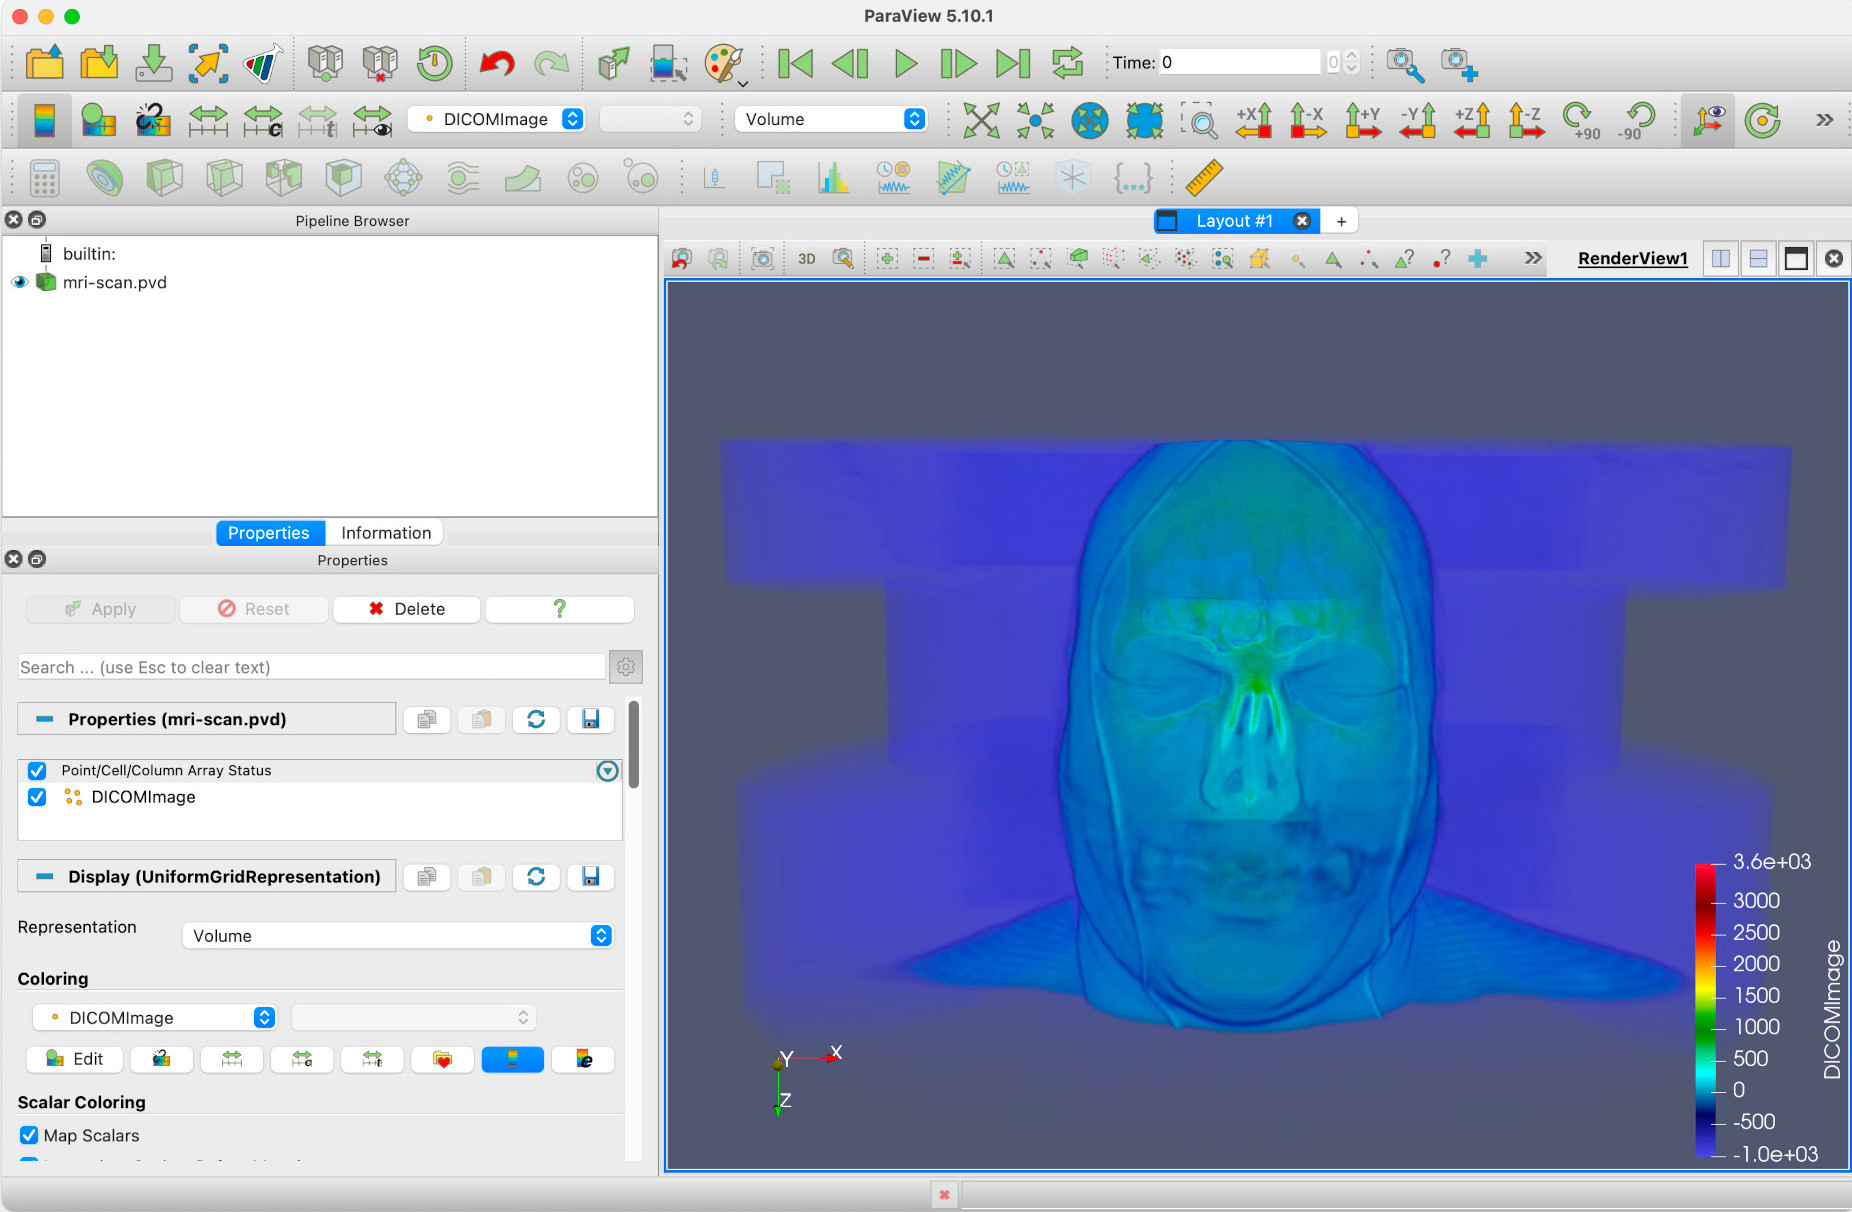
As the render type Volume suggests, this is a full volumetric render of 3D data. DICOM, incidentally, stands for Digital Imaging and Communications in Medicine, and is a standard for storing and transmitting medical images. More can be found on DICOM at the DICOM Library. For now though, we’ll treat the DICOMImage field in Paraview as a measure of object density.
Arranging and slicing the view
Paraview is not designed by default to deal with MRI scans, although it does support DICOM image sets. That said, we can still get useful information out of them. This we will do now.
Let’s suppose we want to get the horizontal dimensions of the head above the eyebrow. Firstly, we create a Slice filter, select Z Normal, then click Apply.
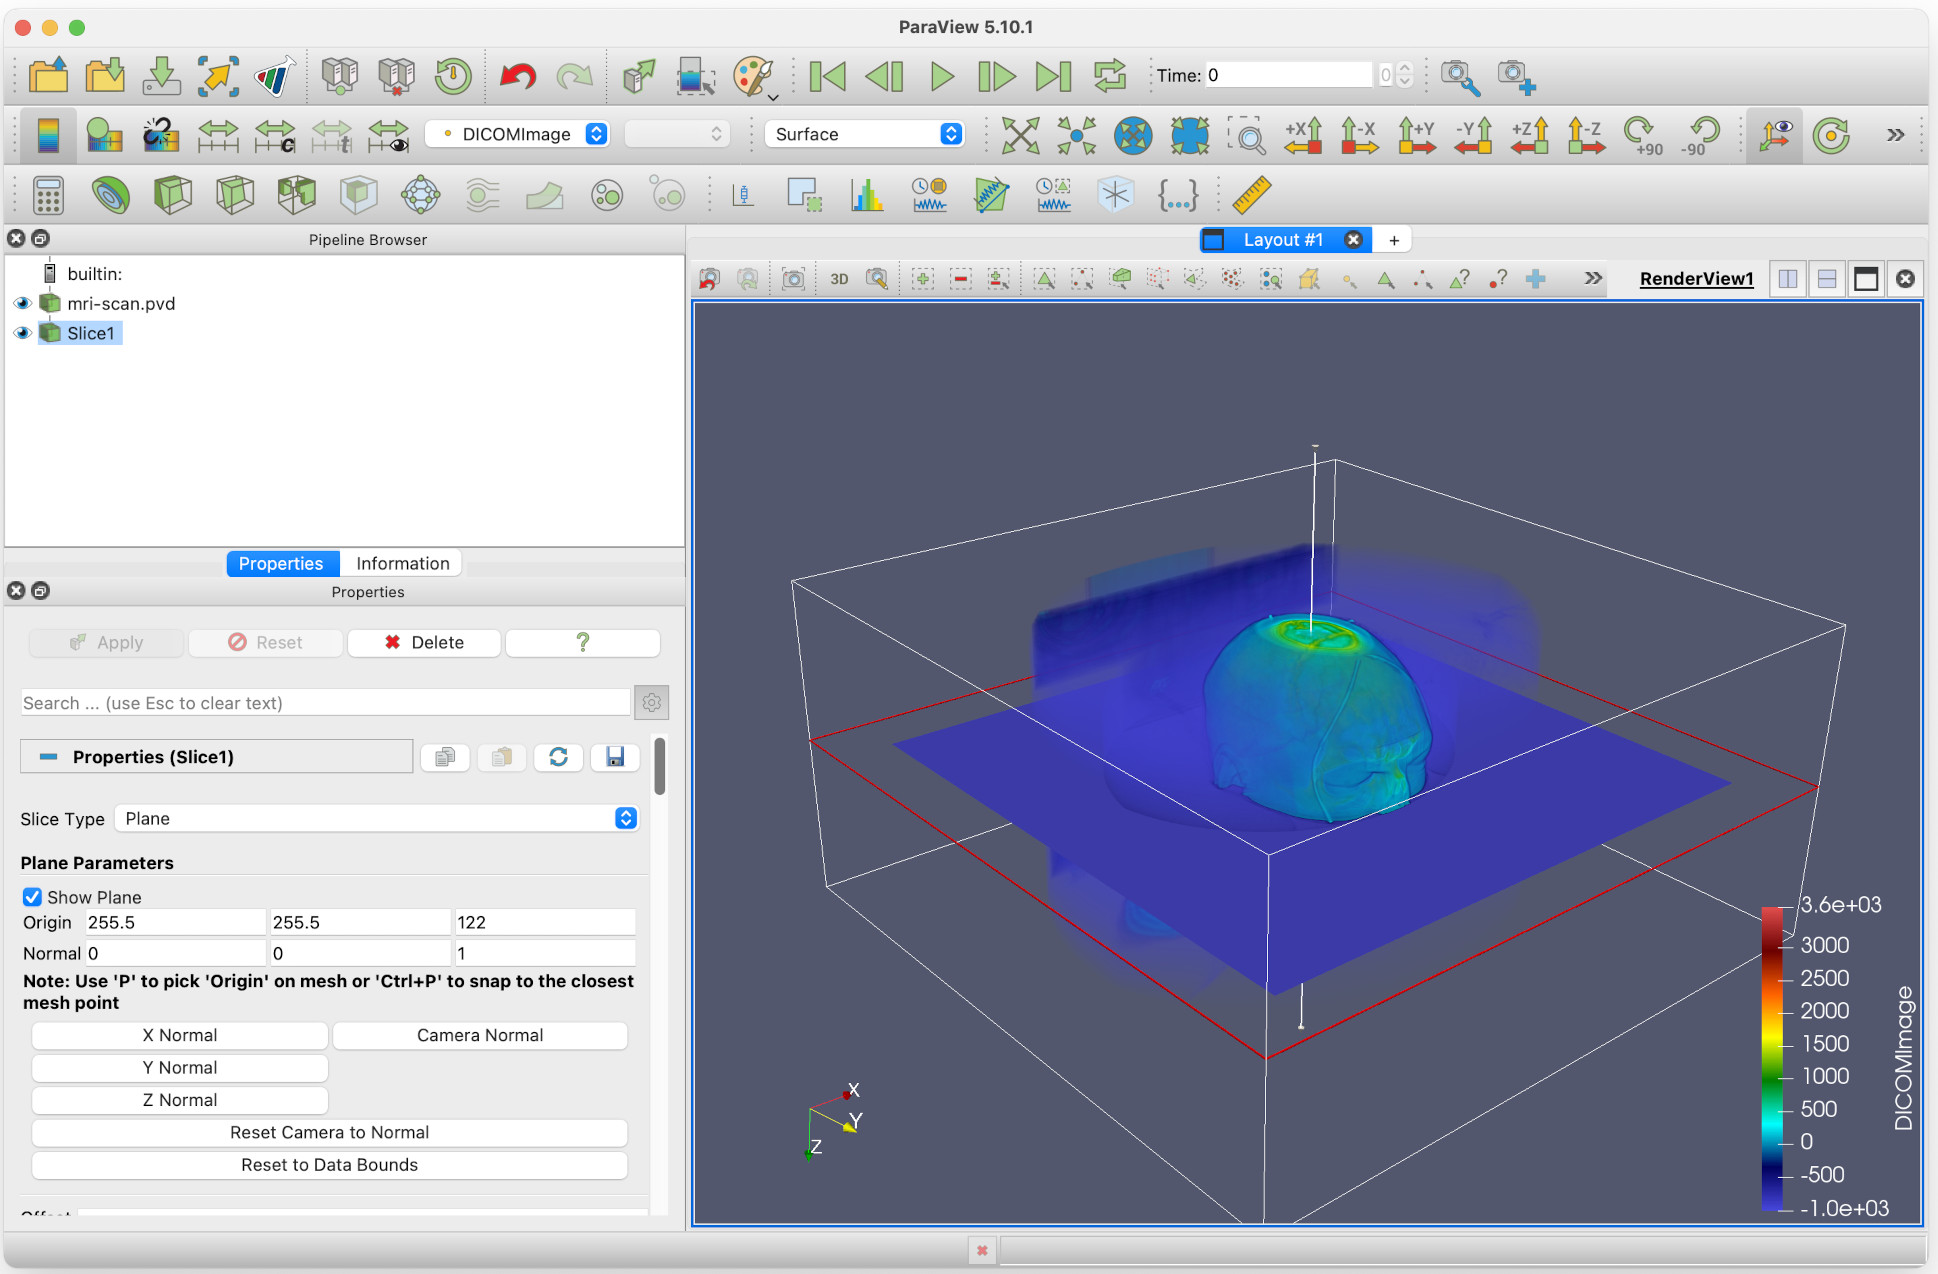
By clicking and dragging the red horizontal edge of the slice, we can move this to above the eyebrows of the head. Do this, and then:
- Uncheck Show Plane under Plane Parameters. This will stop the plane being moveable.
- Hide the original full 3D MRI image, by clicking on the eye icon next to mri-scan.pvd.
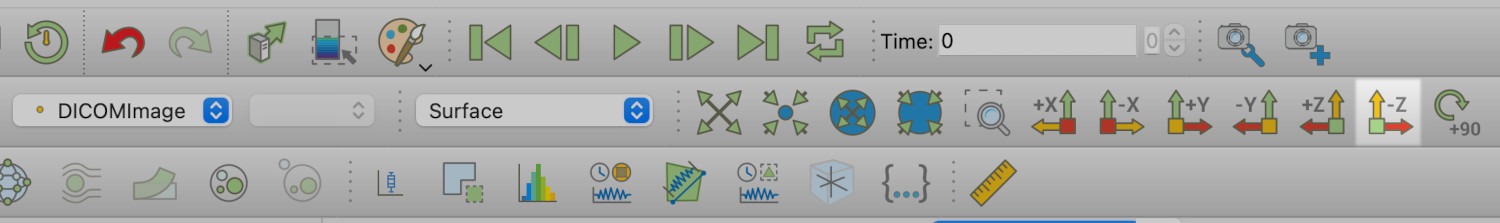
- Reorient the view to look down on the slice by clicking on the -Z axis icon in the toolbar.
Zooming in a bit gives a clearer view in the main window.
Measuring
We are going to assume that green shell represents the skull, with the light blue being the outer layers of skin and tissue. We want to measure the cranium.
Firstly, we make the view 2D. We do this by click on the 3D button at the top of the main viewer window.
This will change the view to 2D, which makes our next tasks easier. You want to zoom in again at this point.
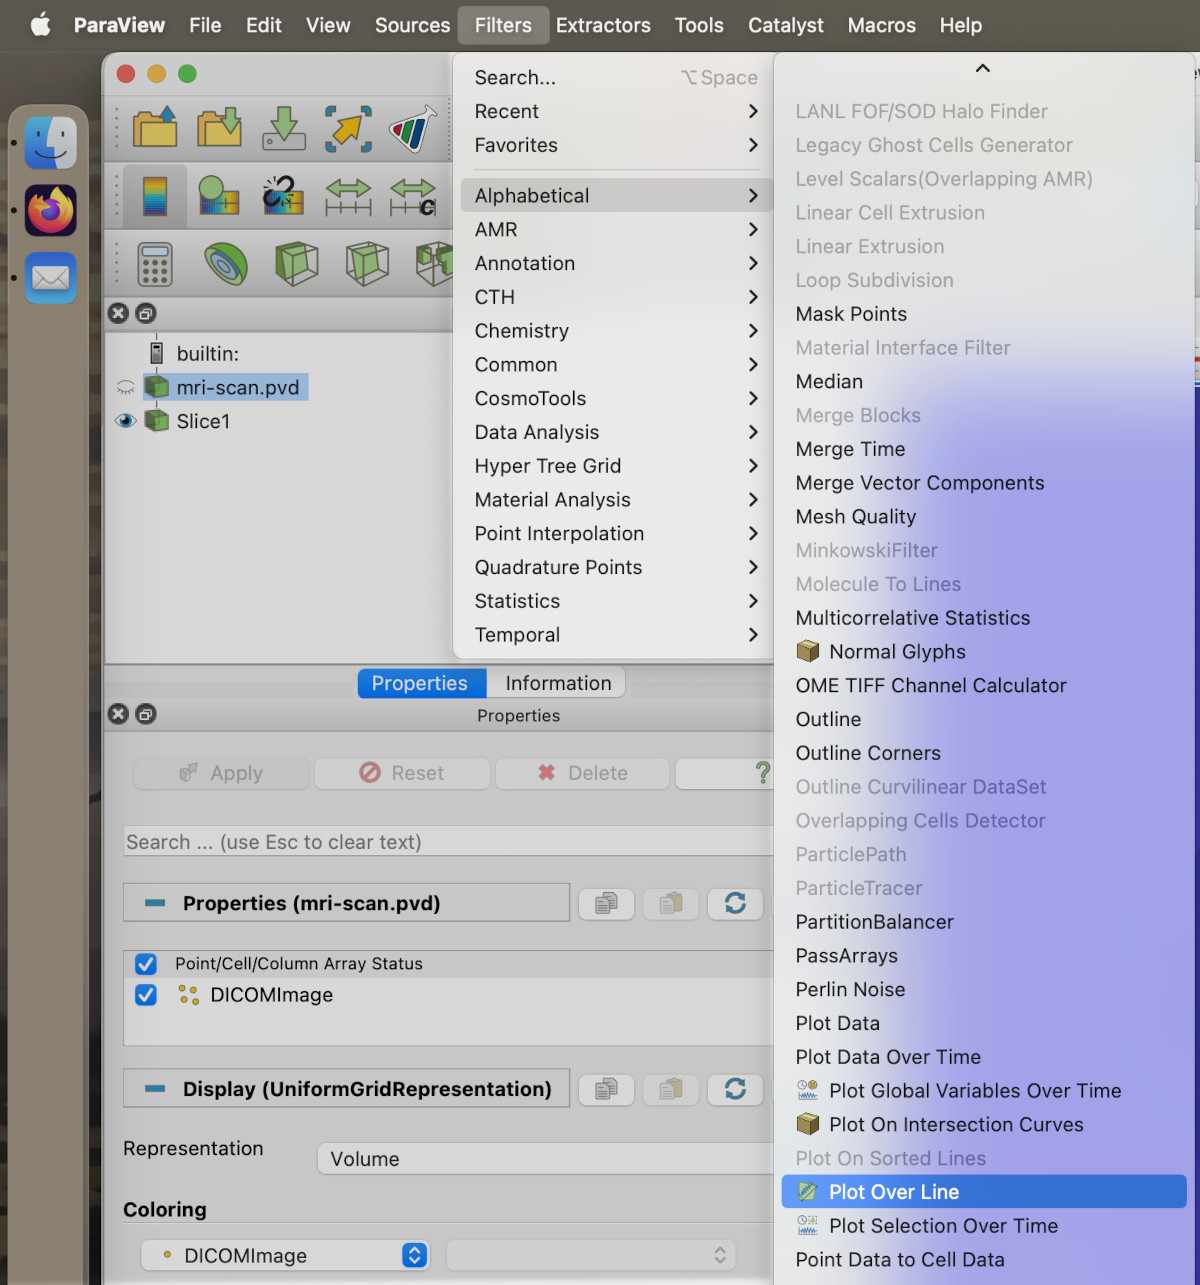
We want to measure the width of the cranium in the X direction. We can do this, and more, by adding a Plot Over Line filter.
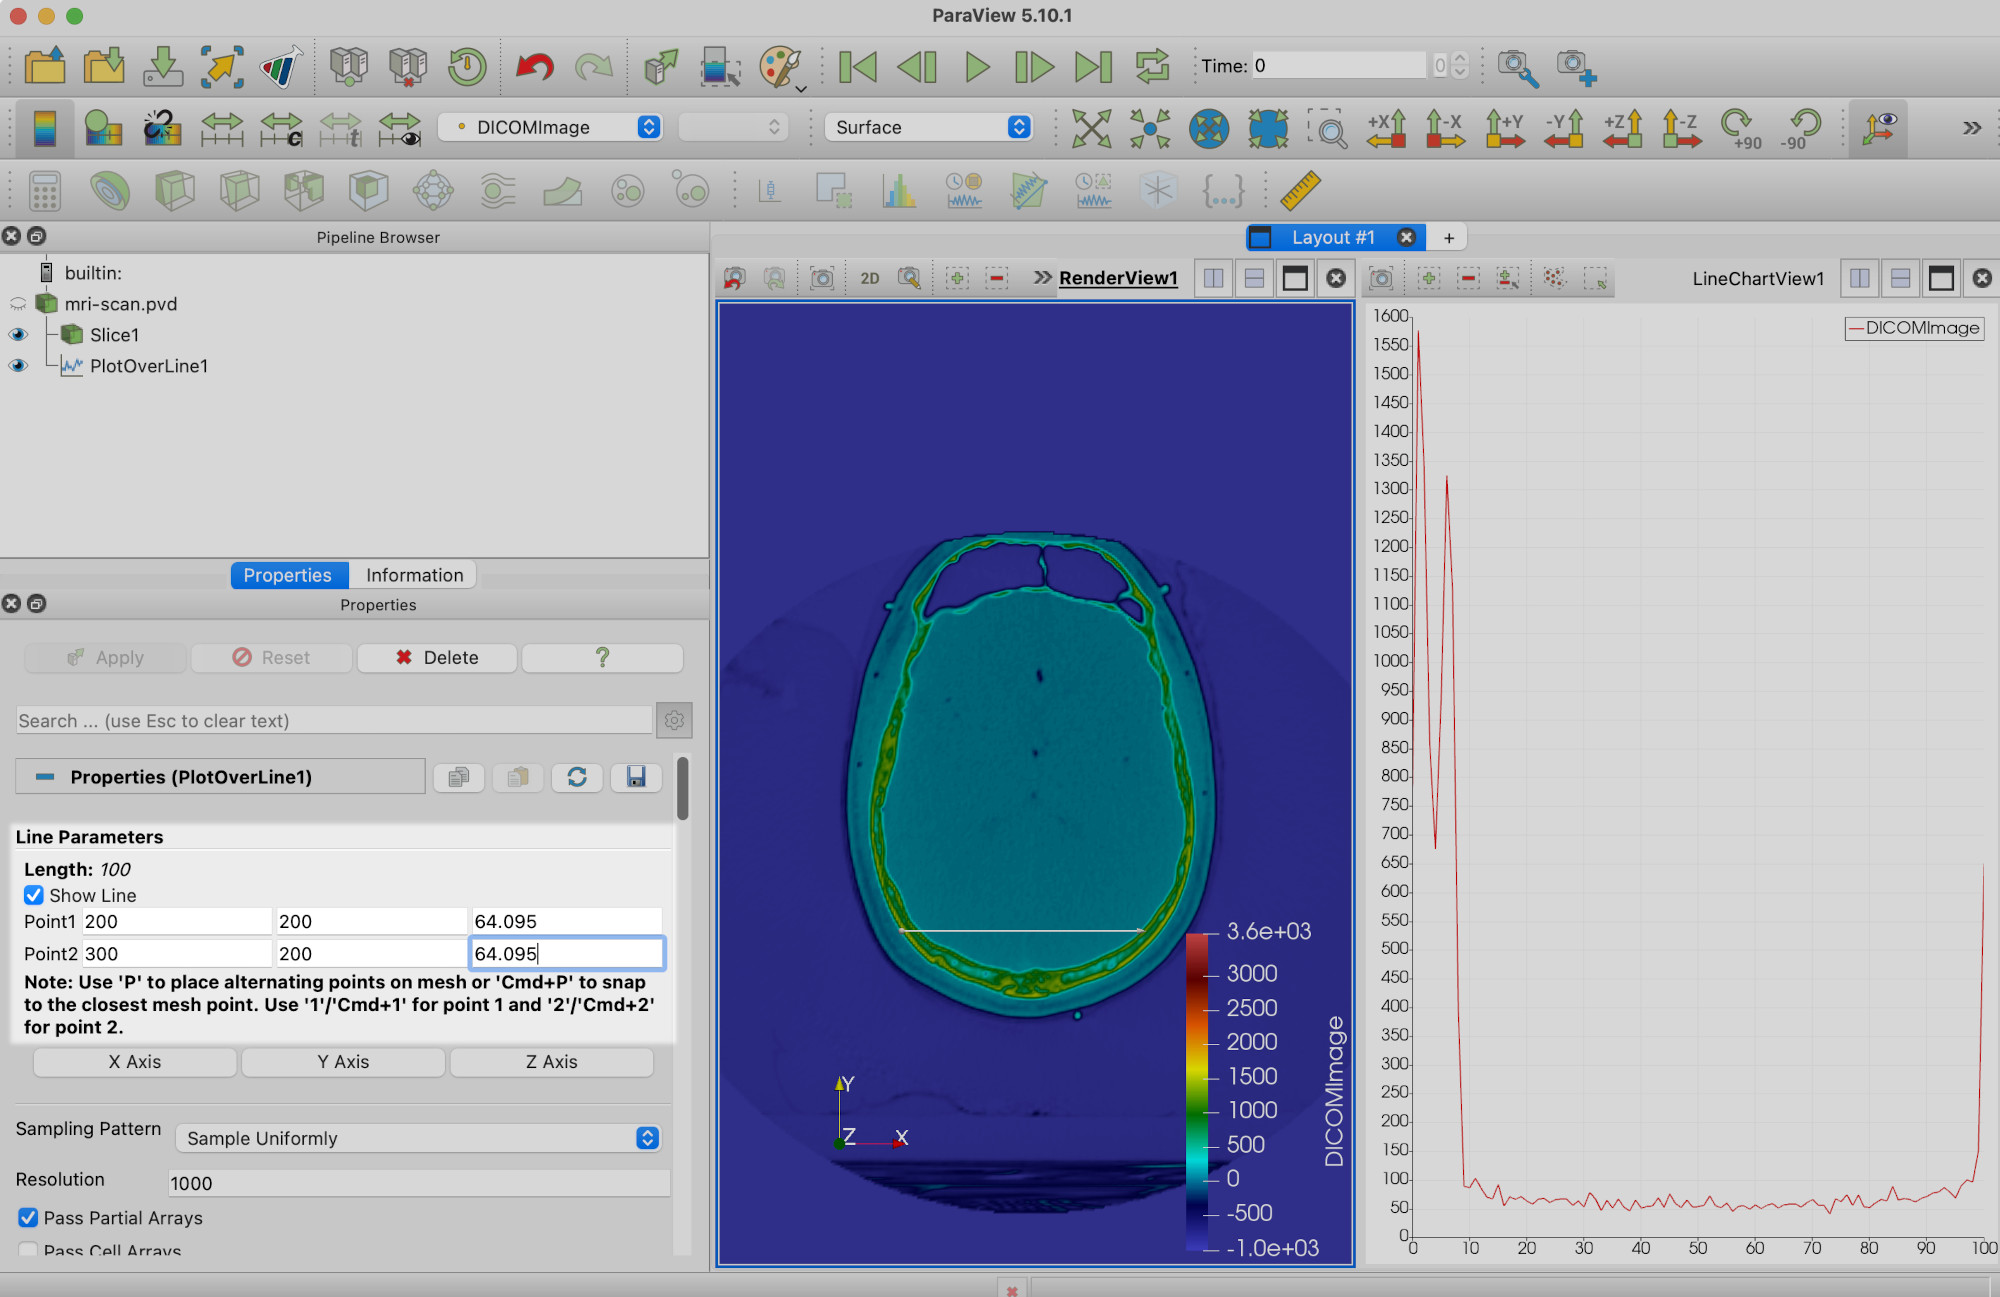
This will give us a matrix of values to enter the start and end points of the line.
- We want to make sure the line is visible on the screen, so it should be within the limits of the skull slice.
- In particular, the z-coordinates should be just above the slice.
- Click Apply.
(You’ll note a line graph has appeared on the right hand side. We’ll get to this later.)
We’re now going to move the ends of the line to the widest part of the skull. You will need to click Apply once you have done so.
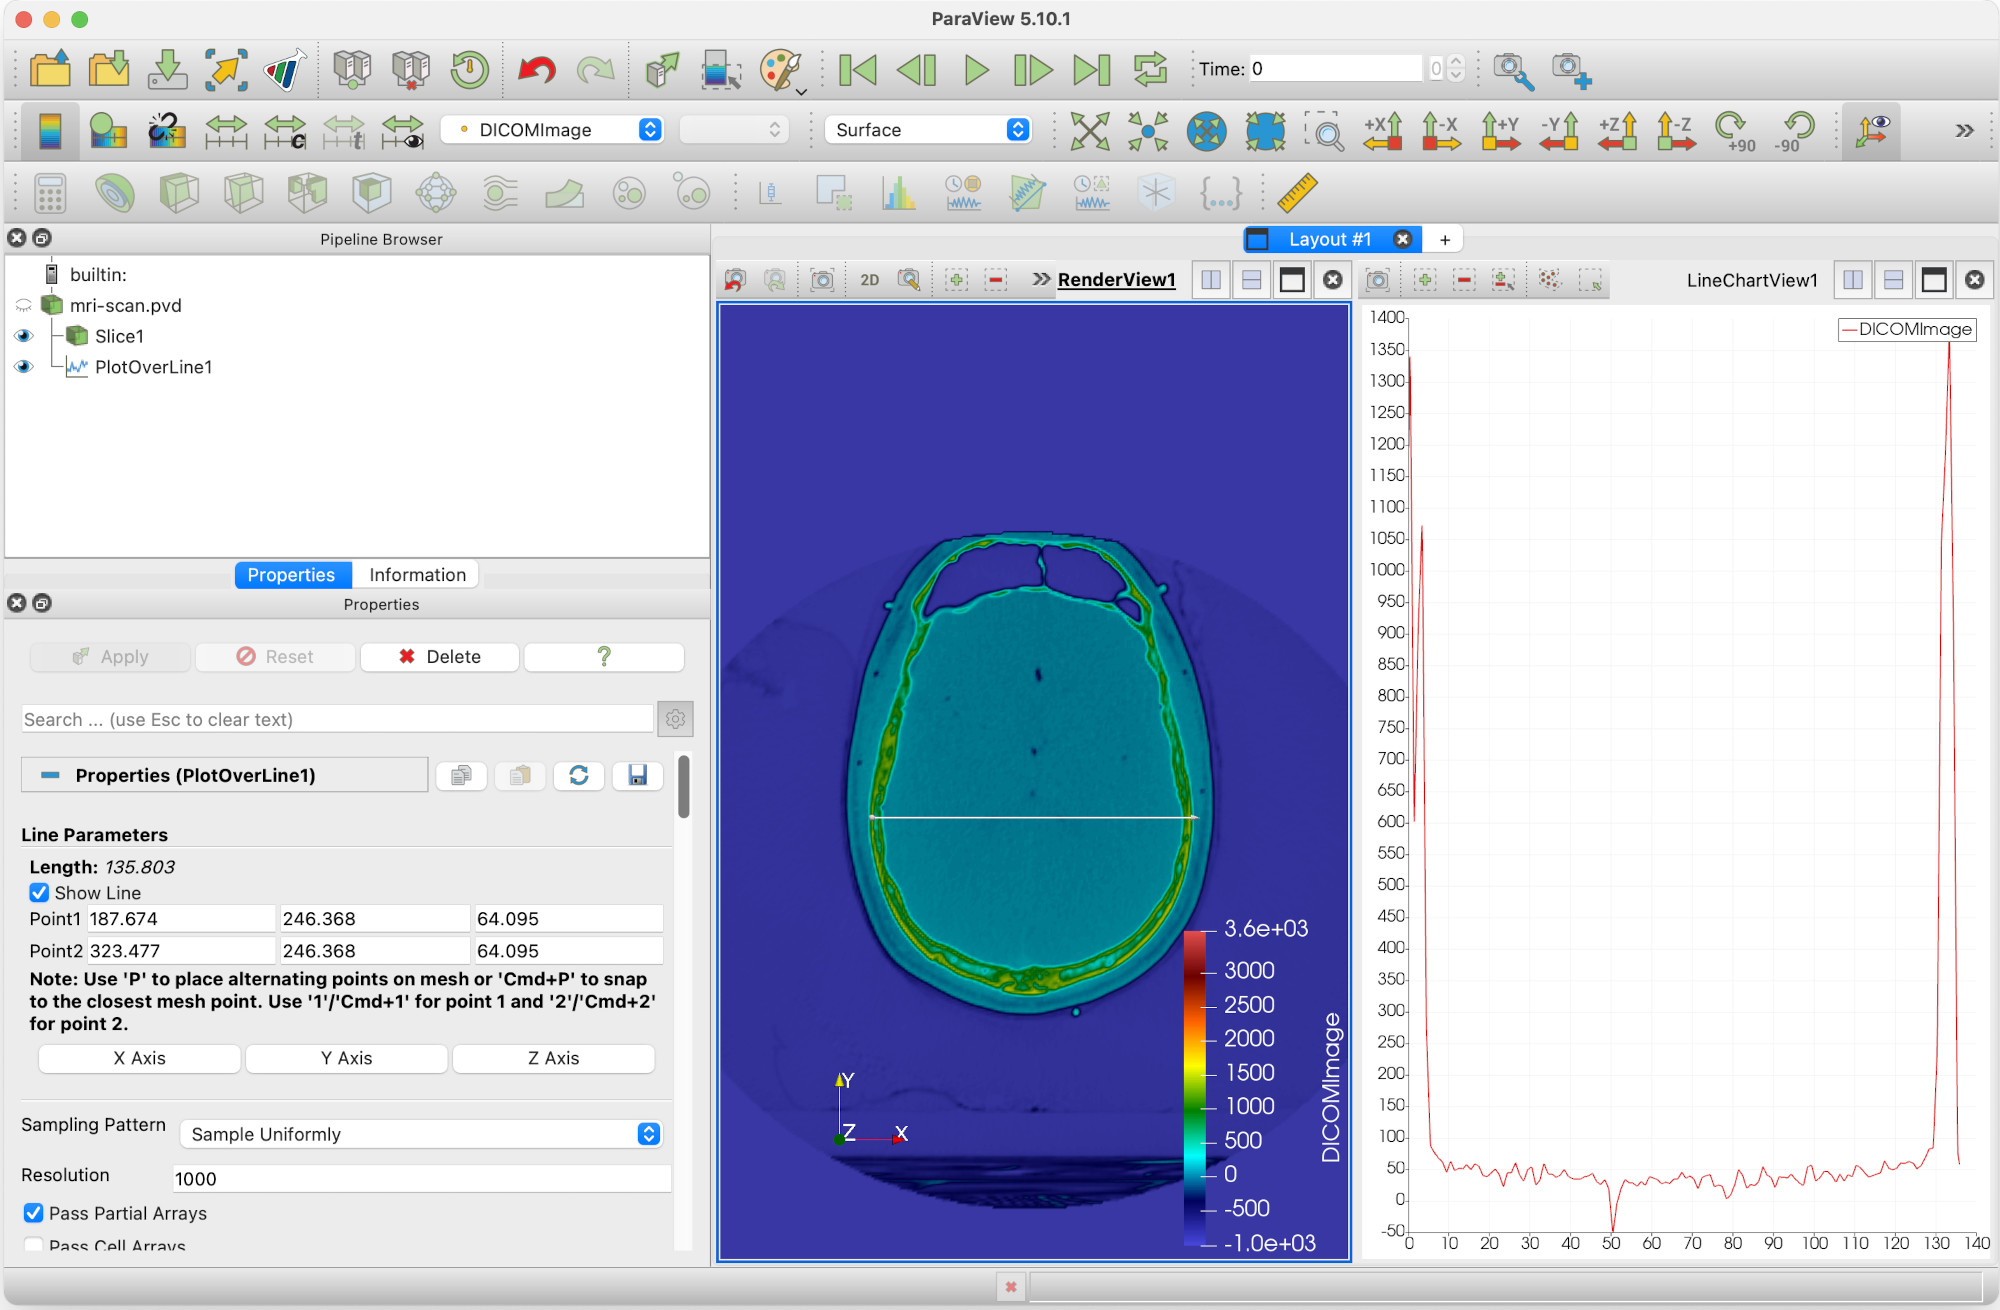
We can now see that under Line Parameters the width (here, length of line) is 135.803 units. But we can get more information than that.
Exporting the data
Returning our attention to the right hand view pane, LineChartView1, we can see that Paraview has plotted the values of DICOMImage along the length of the line.
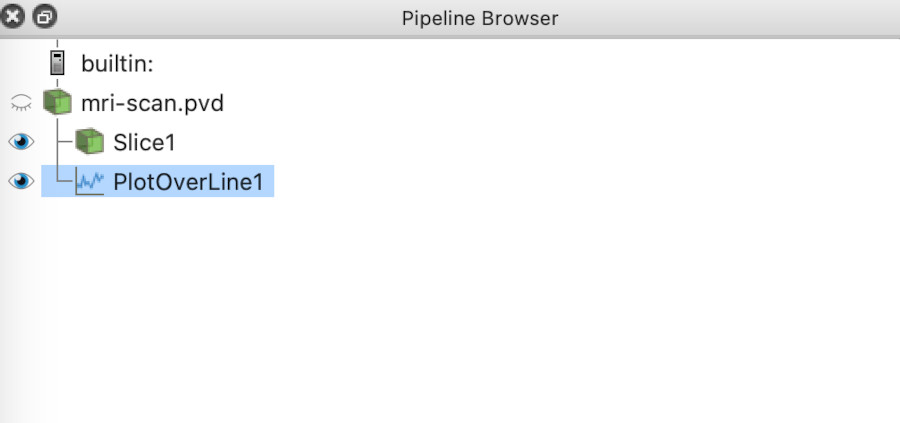
This is data we can export for use elsewhere. First, we have to click on PlotOverLine1 within the Pipeline browser.
Then go into the File menu, and select Save Data. You’ll see this dialog window:
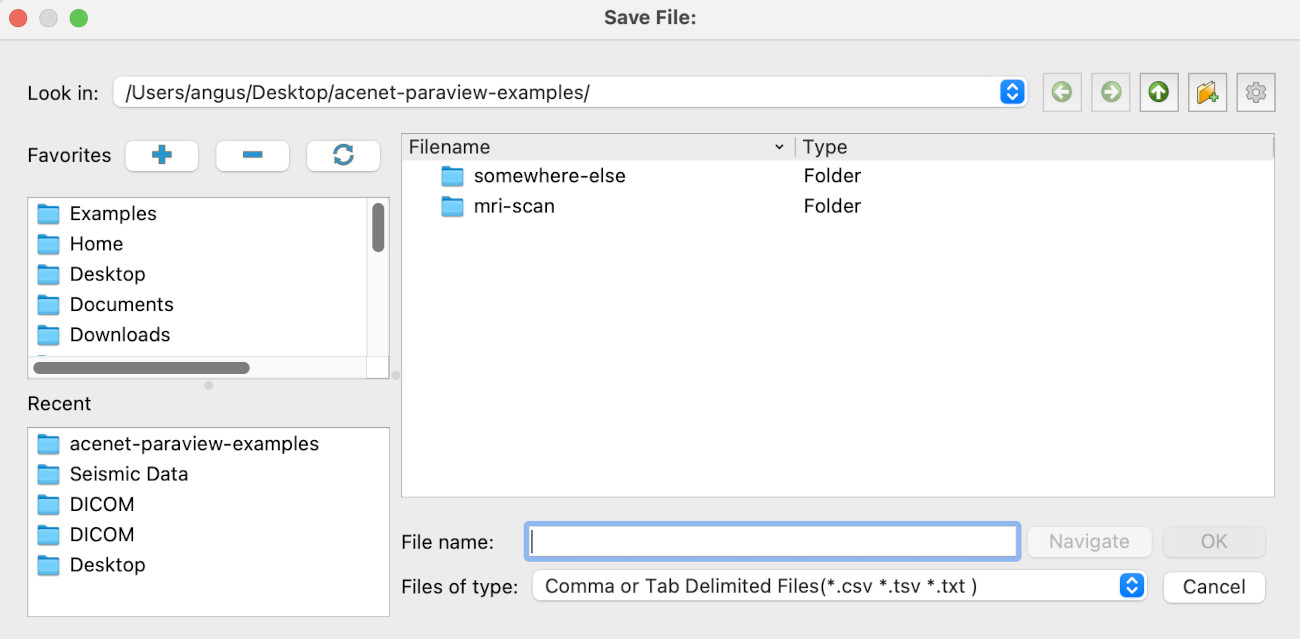
Notice that the file type is CSV. This is good: this is what we want. Once you have navigate to the directory you want to save in, enter your filename. We’ll call this one brain-sample.csv . Click on OK.
This will open another dialog. We don’t need anything but the defauts, so click OK again.
We now have a file we can use elsewhere. For instance, if you open it with Excel, you will see somethine like this -
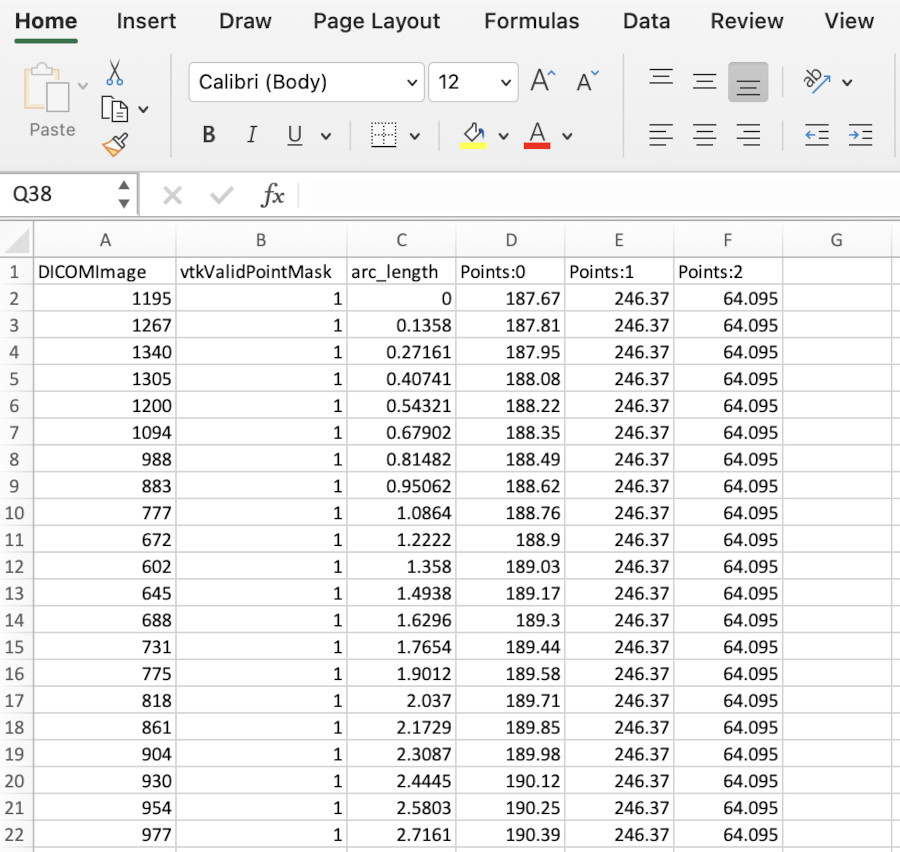
The column have been widened to see the column names. They are, in order:
- DICOMImage. This column contains the interpolated values of the field along the line. If there were multiple fields in the Paraview data, they would appear after this.
- vtkValidPointMask. A Paraview-specific diagnostic we don’t need to worry about it.
- arc_length . The length along the line of each point, moving from the beginning to end points.
- Points:0, :1, :2 . The x, y, and z co-ordinates of each point.
Summary
This is just a taste of what Paraview can do - more will be shown in the next section.
Key Points
Paraview can work with other analysis tools by exporting data to file
These files can be in a variety of formats used by other software (eg. CSV)