Opening Paraview and viewing a dataset
Overview
Teaching: 15 min
Exercises: 5 minQuestions
How do I look at data?
Objectives
Understanding the window layout of Paraview
How to open data and manipulate the view
Before you start
Paraview can be extremely demanding of your computer’s memory, especially on large data sets.
Please close down any unnecessary any unnecessary programs such as additional browser windows/tabs and office software before proceeding. If you do not, Paraview may run very slowly.
Opening Paraview
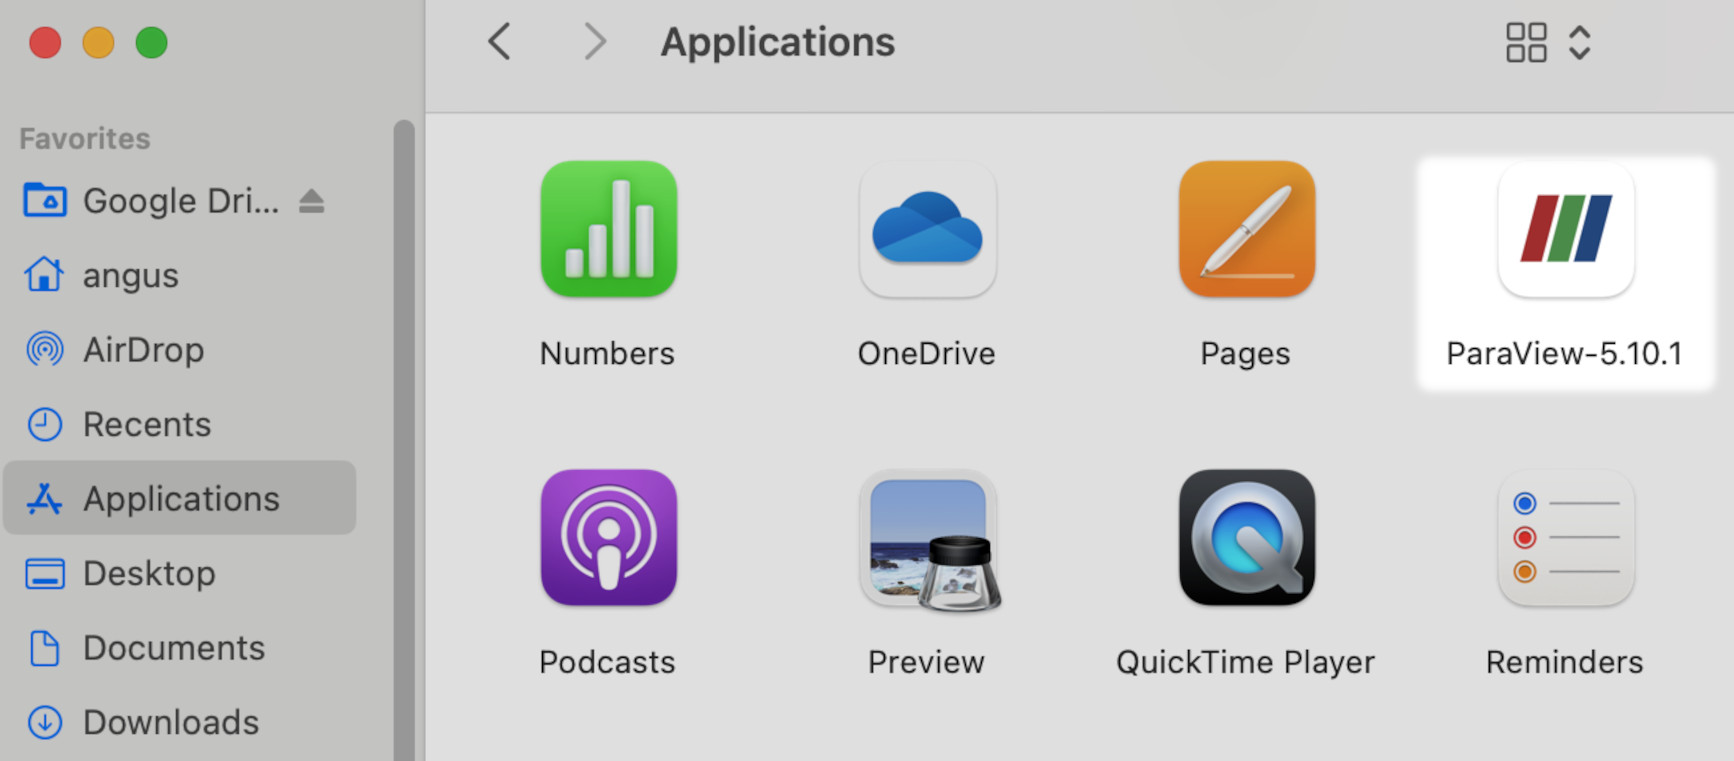
We’ll start by opening Paraview. Assuming you have installed Paraview, click on the Paraview icon. On MacOS, this will be in the Applications folder, ie.
Once started, you should see the Paraview application Window:
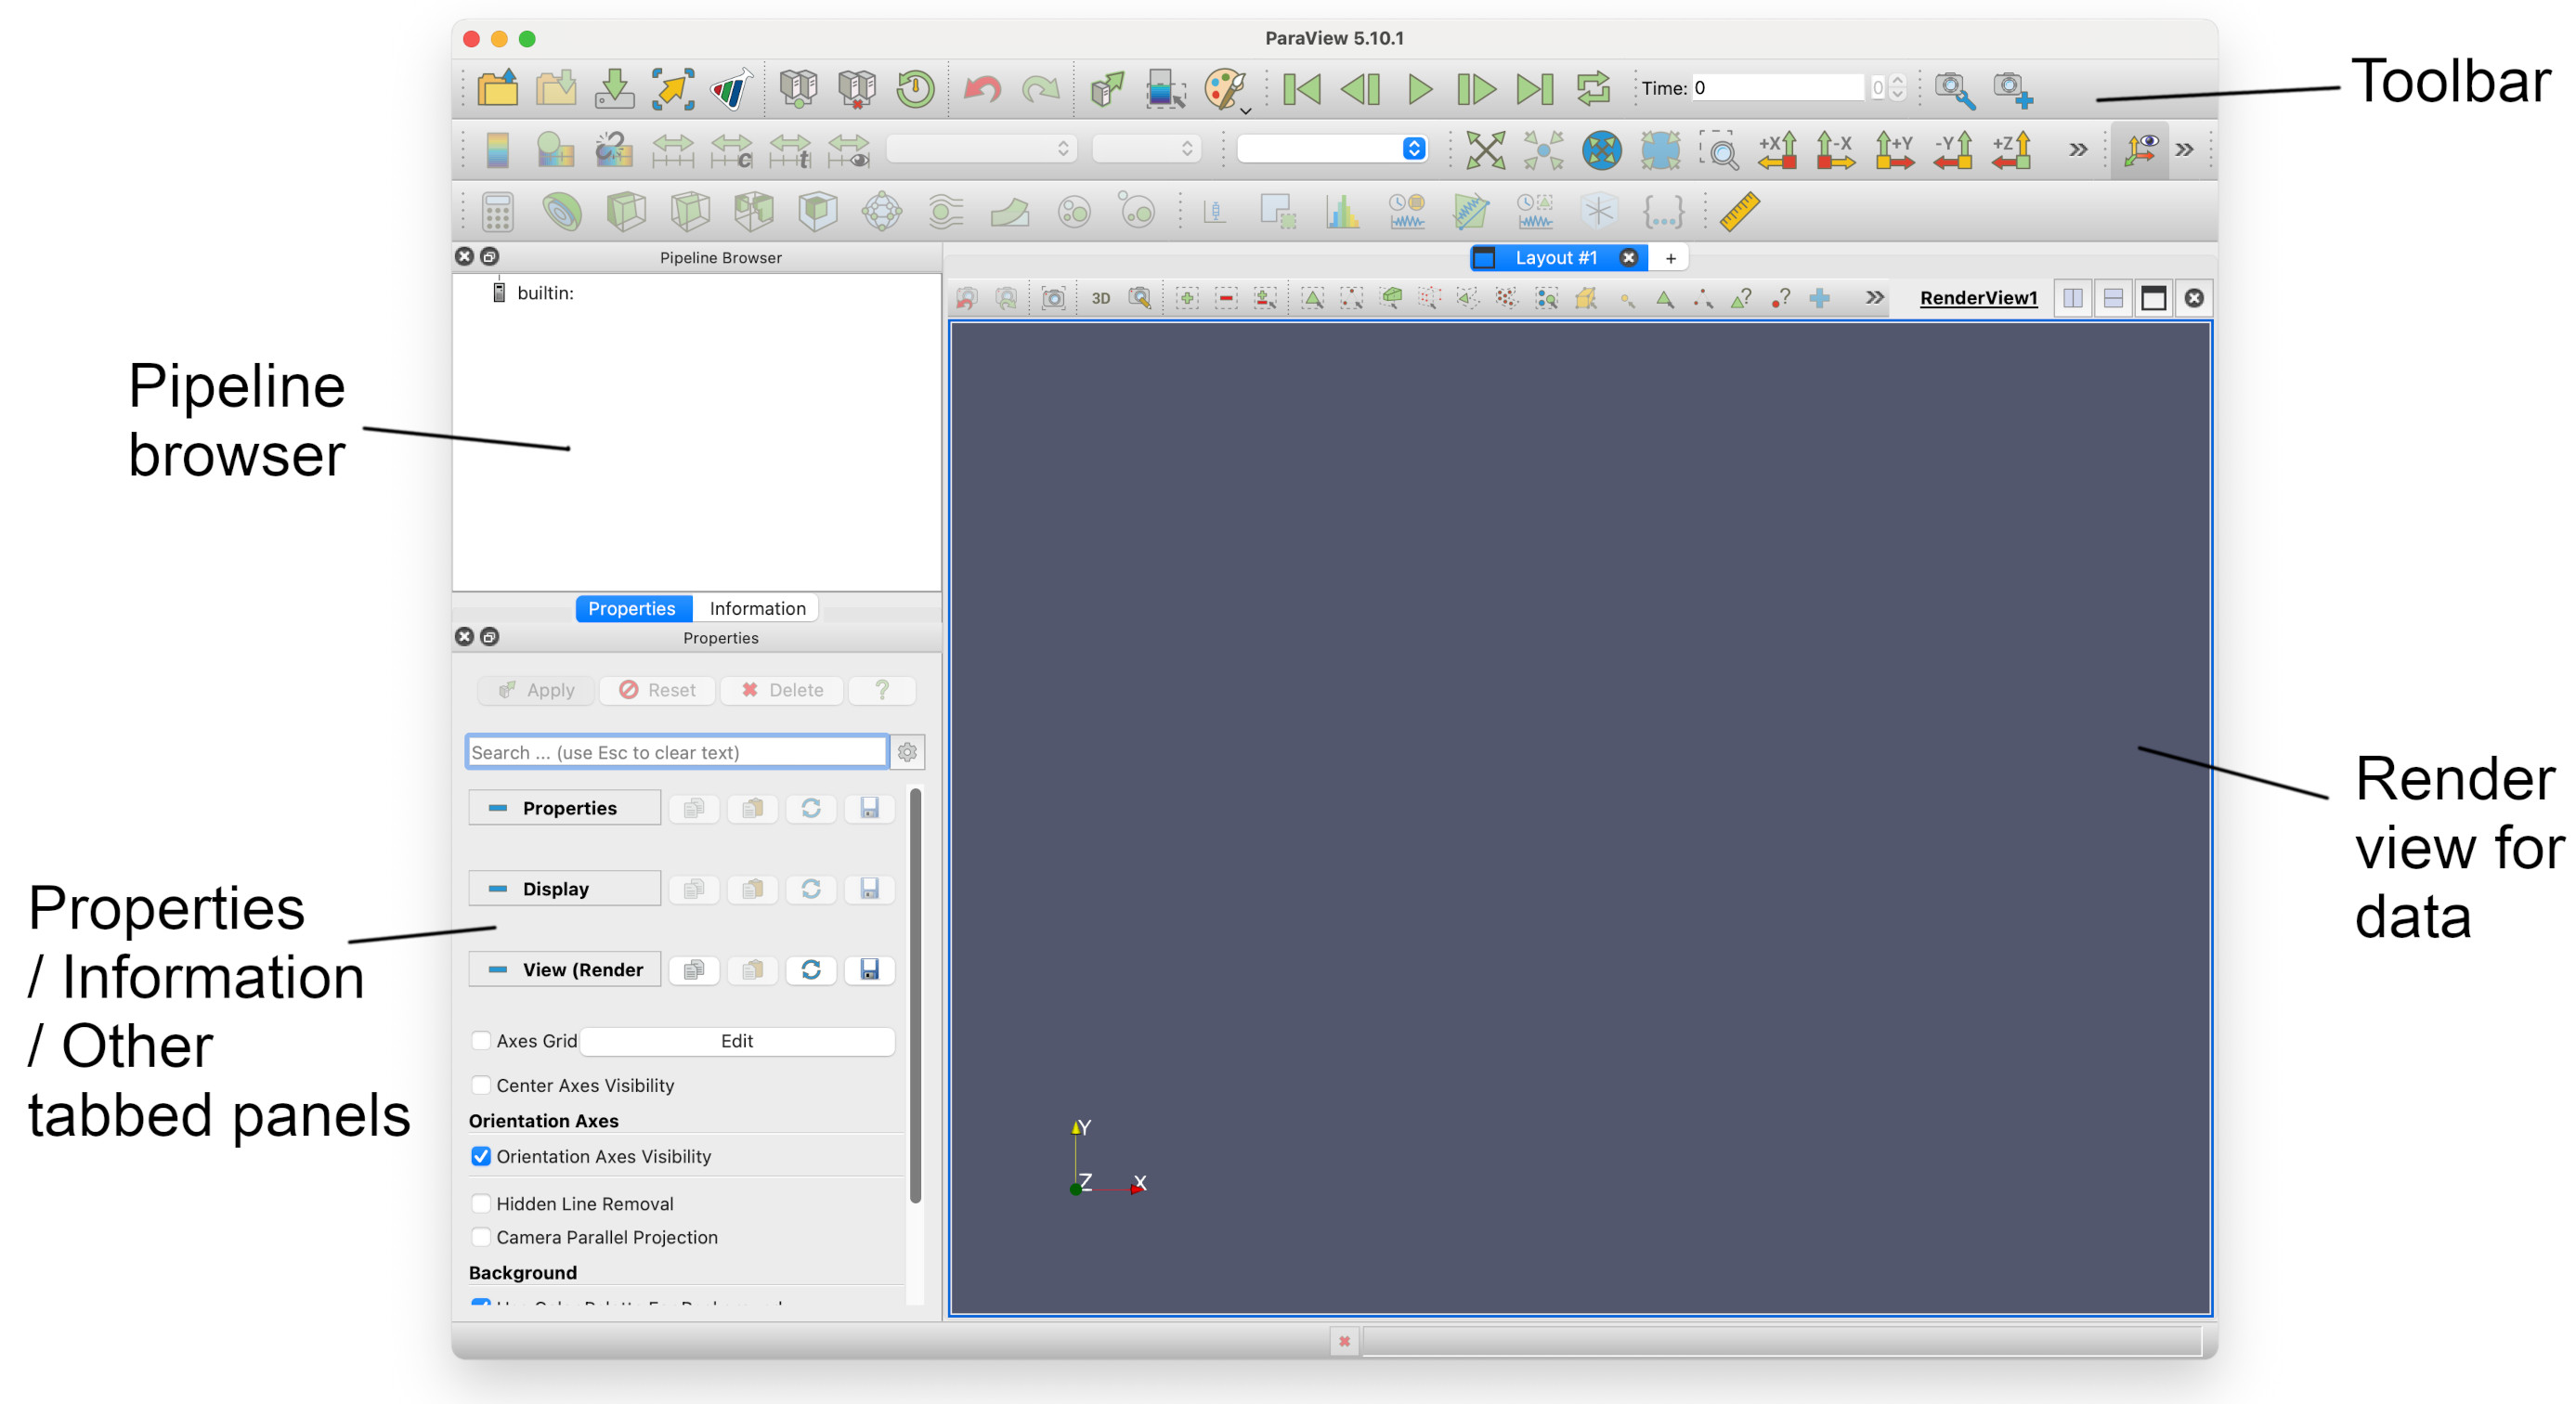
The four main sections of the application window are highlighed above.
The pipeline browser
This displays the processing pipeline in a tree view. Each data source will be a `root’, with filters as seperate or connected branches. It is interactive, allowing you to hide or show the results of filters. You can also select any item on the tree and display its properties.
Tabbed panels
This panel has two tabs, Properties and Information, although more can be added. These are active for the selected item in the Pipeline browser. Properties allows certain basic properties of the current view displayed in the Render view to be changed; Information displays details about the current view, such as number of points, cells and bounds.
The render view
This displays the rendered output produced by the sources and filters in the Pipeline browser. Here you can manipulate the view using the mouse.
The toolbar
The toolbar contains icons which for a selected subgroup of actions and submenus. These are grouped together into file functions, animation functions, field options, view options, and filters. Depending on what part of the pipeline is selected, some of these may be disabled and grayed out.
NB. The complete list of options and commands in MacOS are in the drop-down menus at thetop of the screen (not shown). Under Linux and Windows, these are at the top of the main Paraview window, above the toolbar.
Opening a file
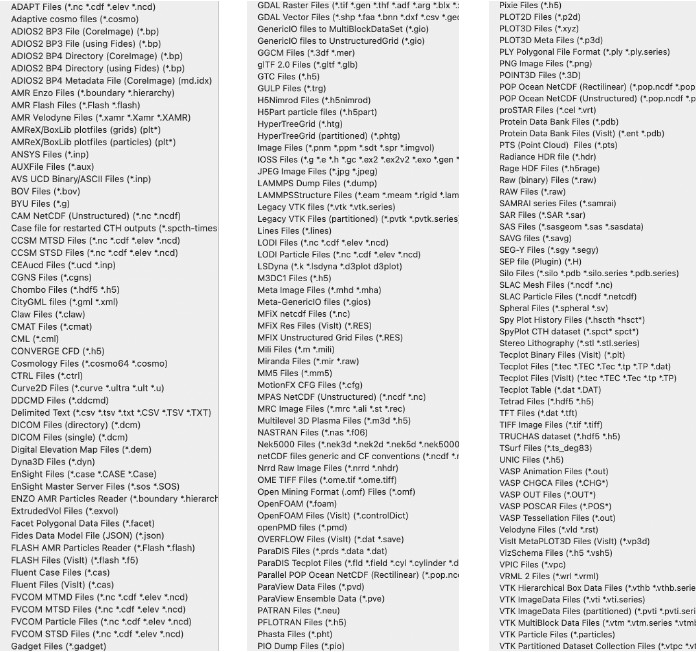
Paraview can import many types of data file formats. Here’s a non-exhaustive list:
We are going to open one of the tutorial data files that you have unarchived onto your desktop. If we click on the *open file* icon 
We get to the open file dialogue -
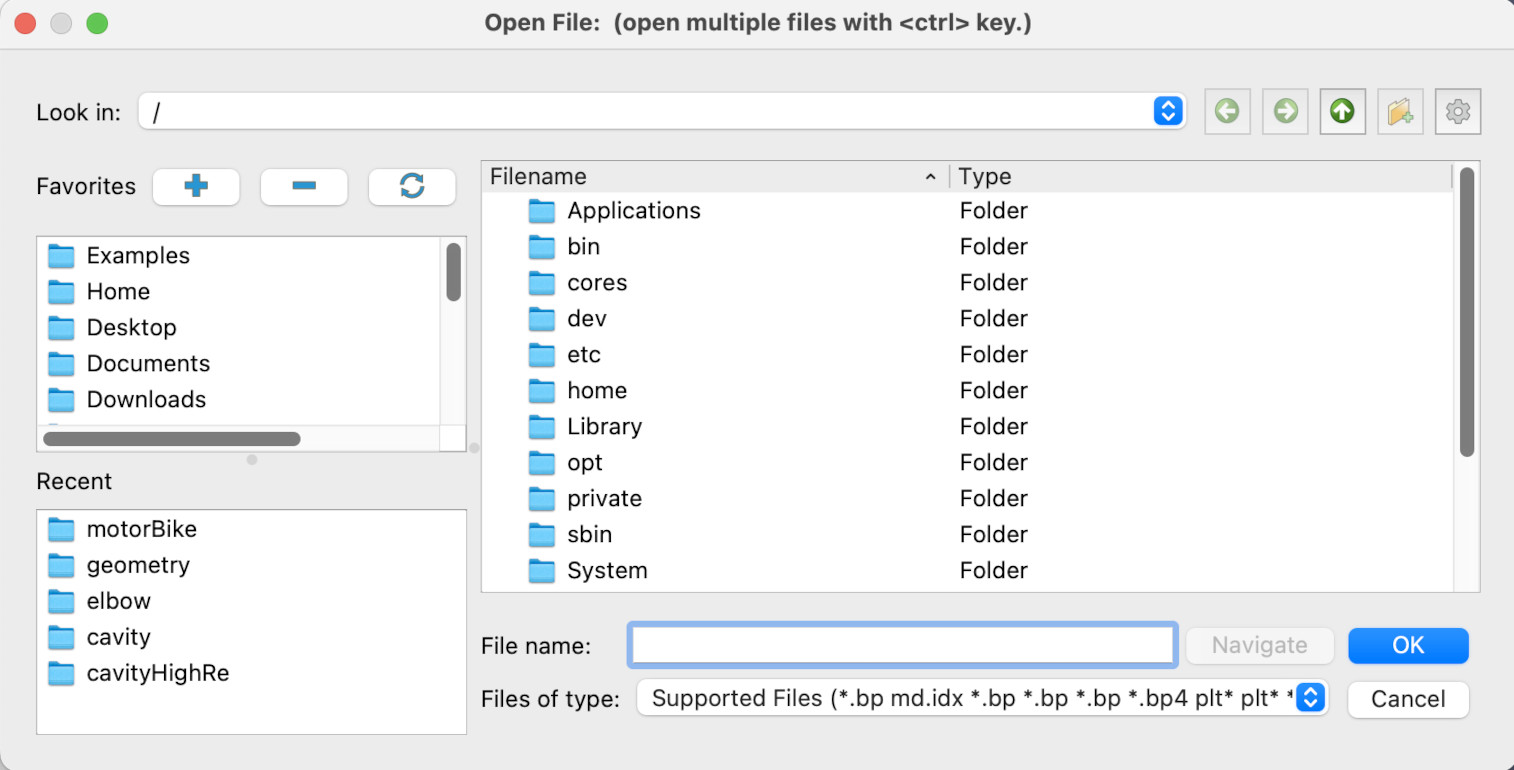
Click on Desktop, then acenet-paraview-tutorial, then disk_out_ref.ex2. Click the Apply button, and you should now have a view similar to this.
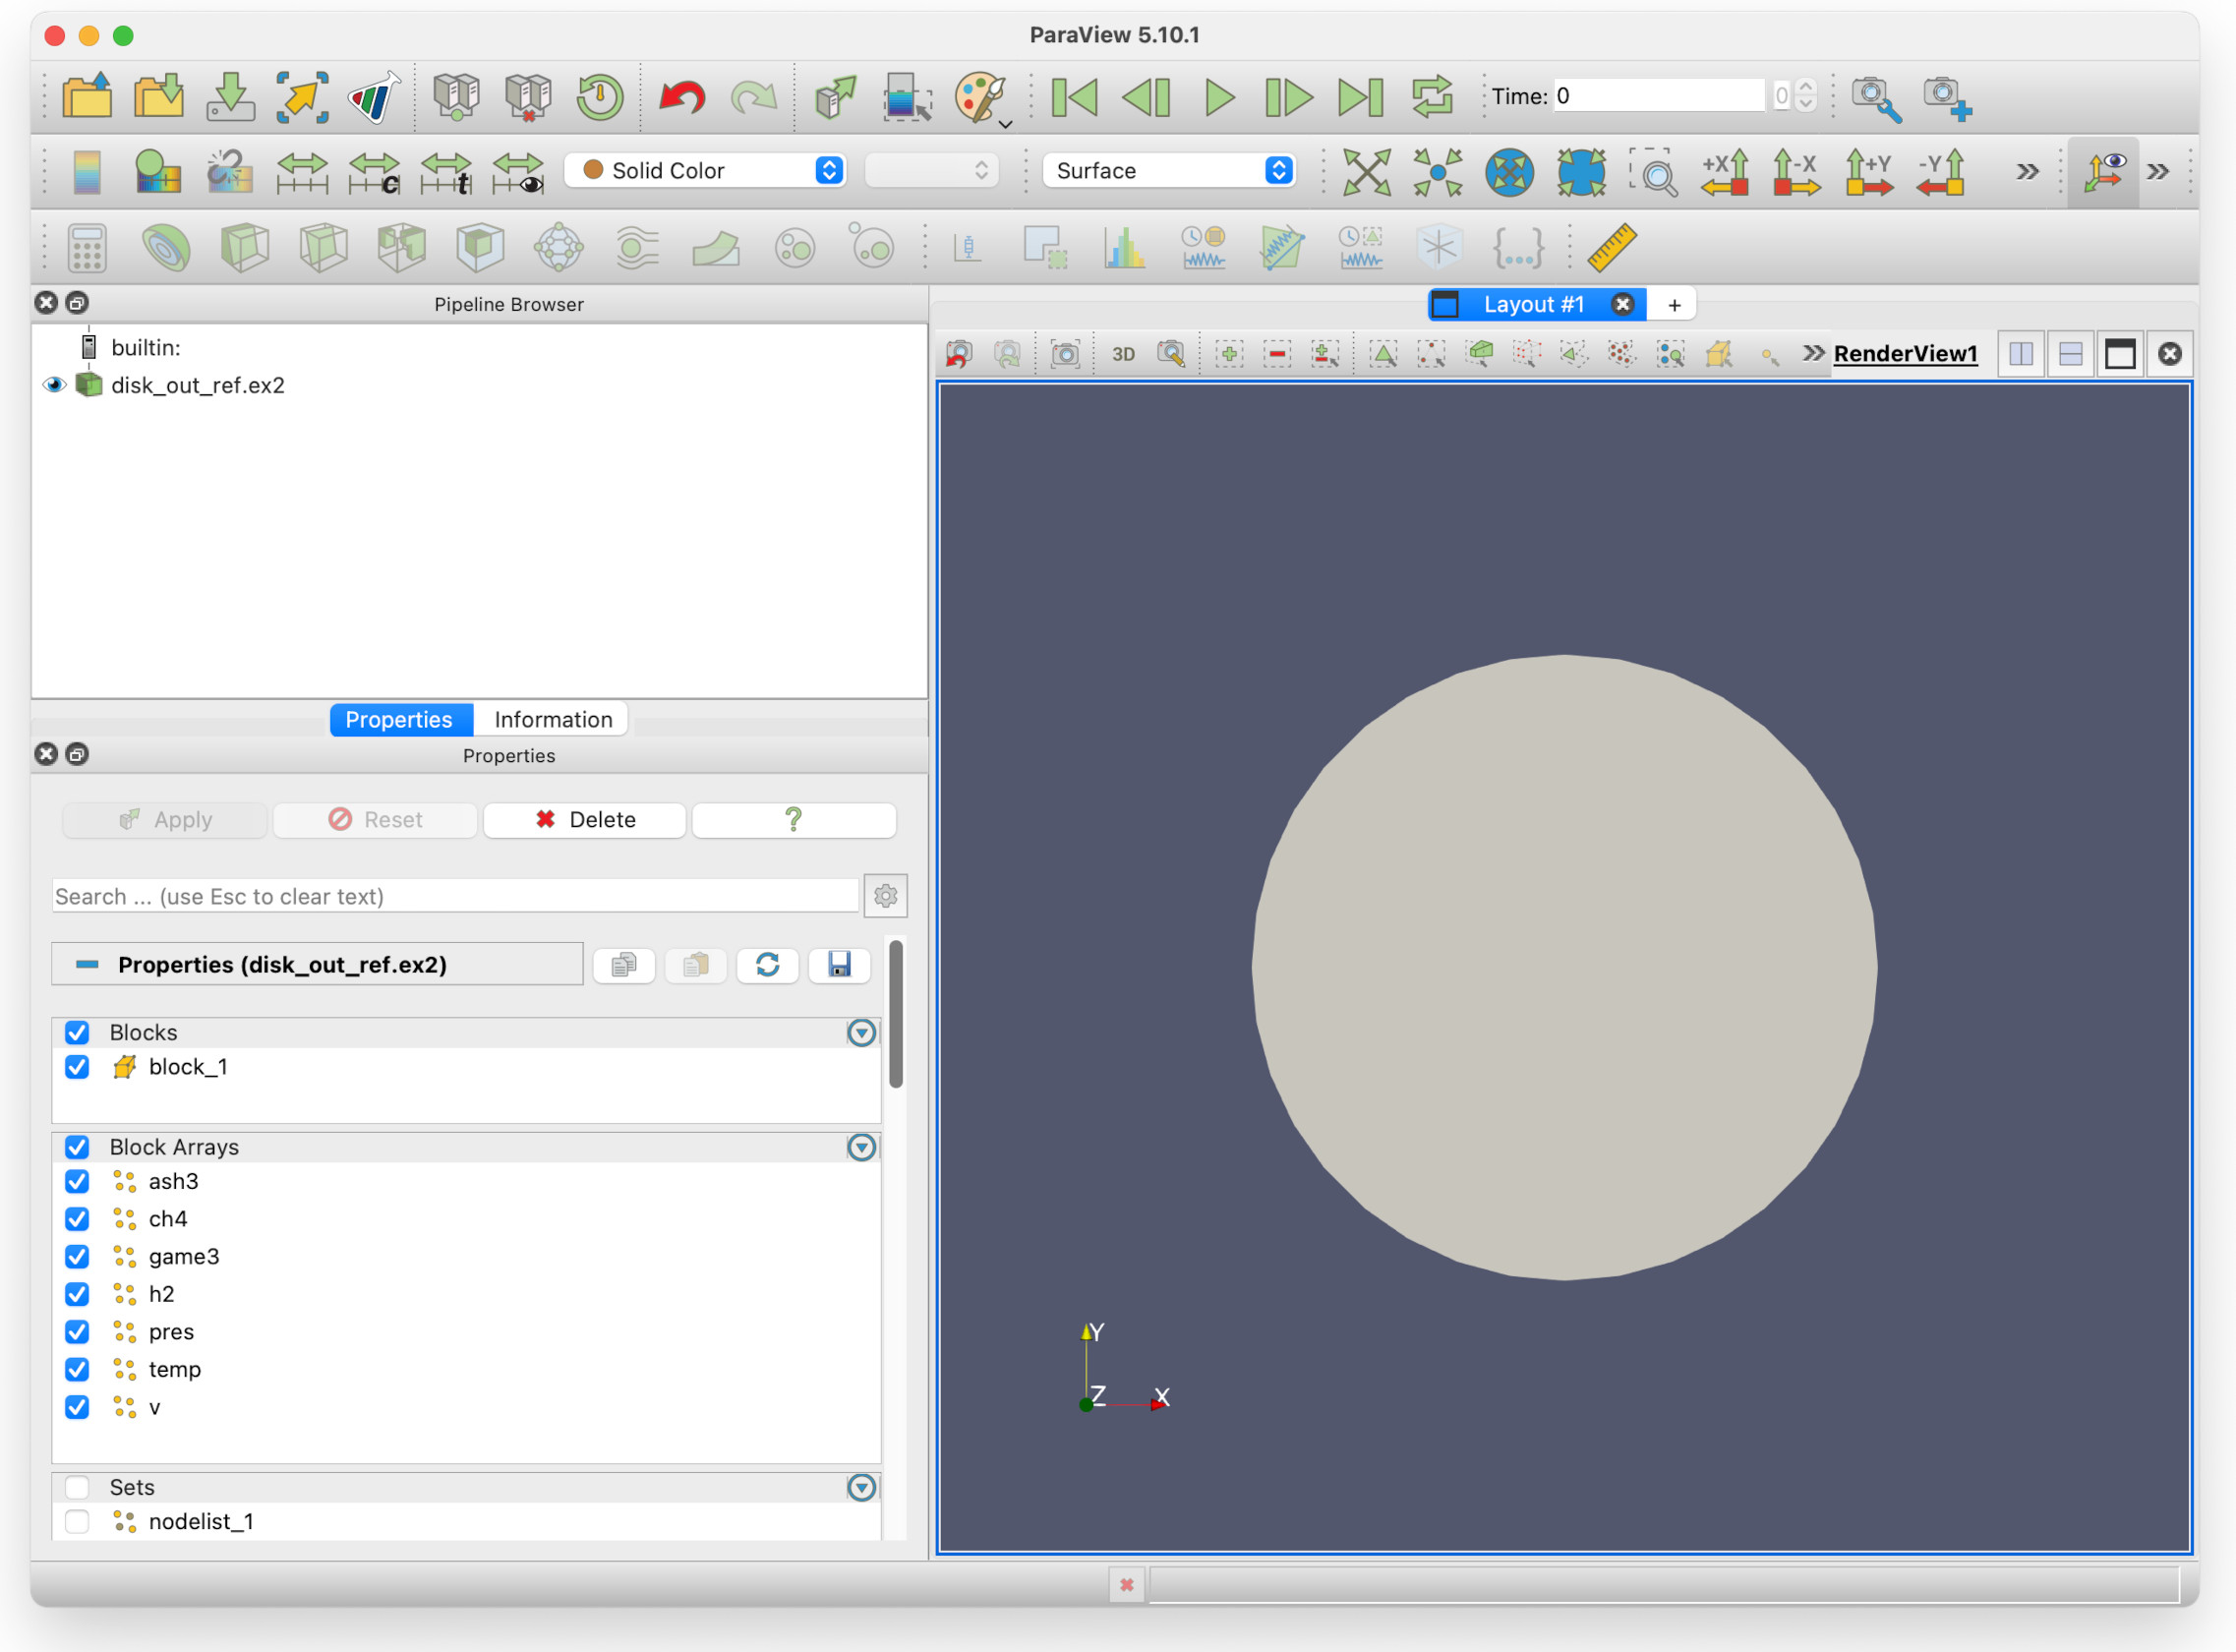
Information about the data file
You can see in the Pipeline browser that there is one data source: disk_out_ref.ex2, the file that has been loaded in. The eye icon beside it can be clicked, to show/hide the view.
The Properties panel shows you the Blocks available (block_1), and Block Arrays shows you the data fields available. The check marks beside them indicate they are enabled for processing.
In the Sets sub-pane (you may need to scroll down with the mouse wheel) there are nodes and surface lists. If we deselect the block in Block Arrays we can select individual surfaces we would like to view.
Manipulating the view
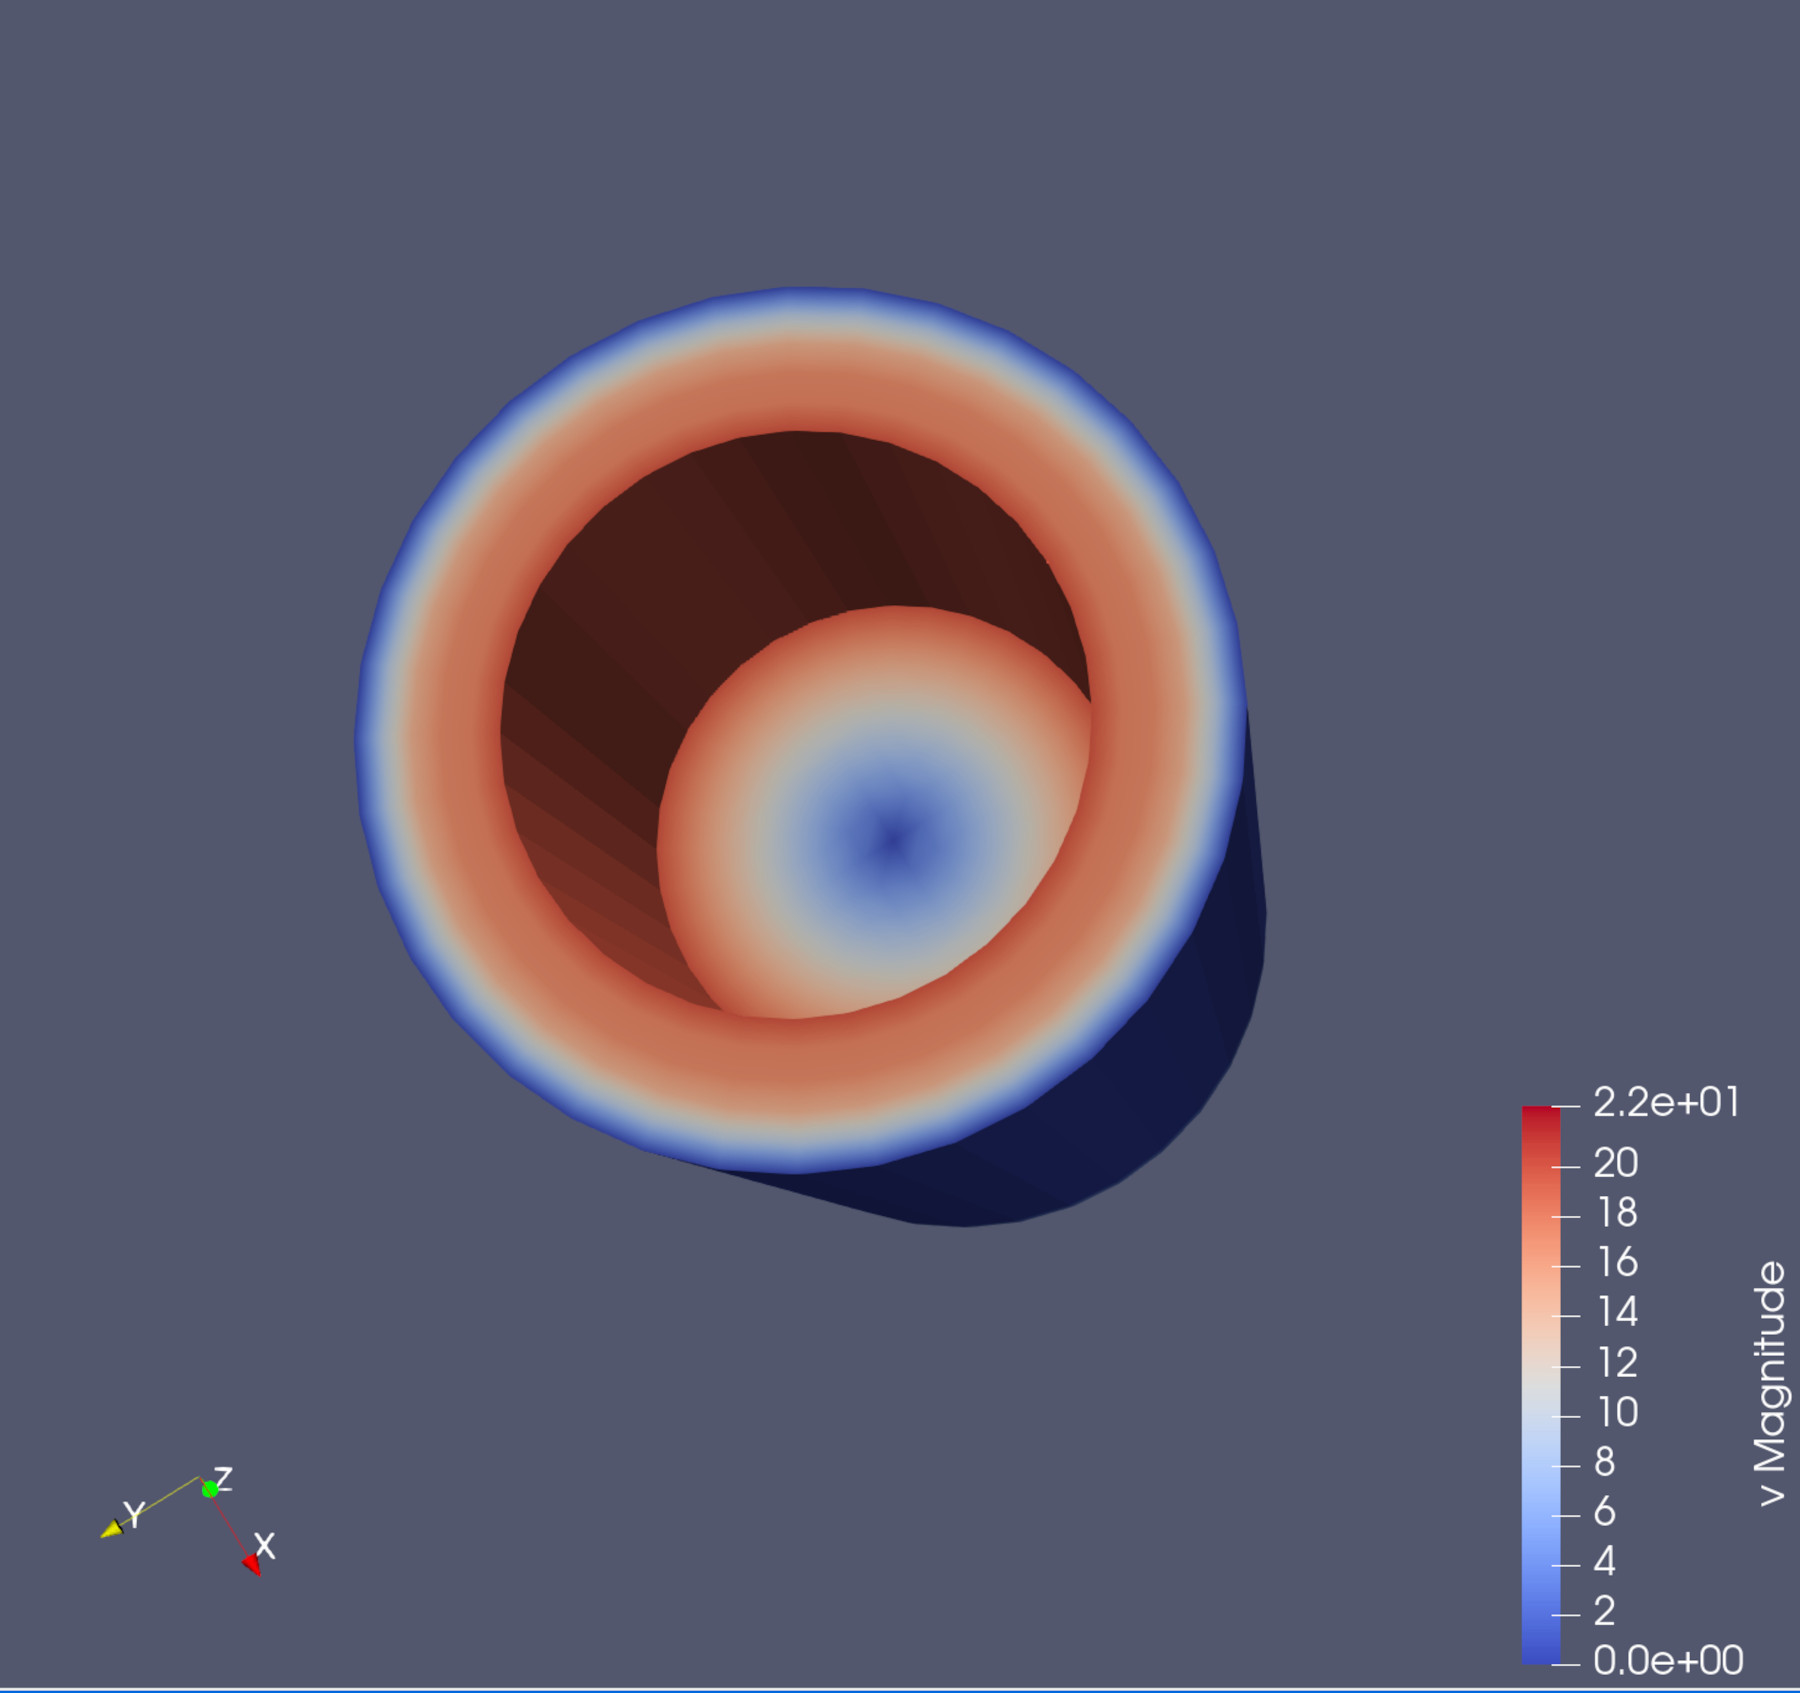
The first thing we can try is colour the object with a data field. In the tool bar, you will see a drop-down box that current contains Solid Color. There is a second menu to the right, labelled Surface. This is the current representation of the object. This can be changed to Points, Surface with edges, Volume, etc. if you so wish.

Click on it and select v (for velocity). This colour the cylinder and also add a legend on the bottom right indicating the range of values within the field.
You can experiment with rotating and changing the view. There are several mouse actions you can use to do this:
-
Left click and drag will rotate the data view about the origin.
-
Scrolling the mouse wheel will allow you to zoom in and out.
-
Middle click and drag will move the object around the render view window.
Try rotating the view so you can see hole in the cylinder.
Key Points
Paraview supports many types of formats
It can view 2- and 3-dimensional data
The mouse can be used change the view