Introduction to Paraview
Overview
Teaching: 15 min
Exercises: 0 minQuestions
What is Paraview?
Objectives
Understand what Paraview is and where it can be used.
Paraview and Visualization
Paraview is an open-source science/data visualization and data analysis package developed by Kitware, that is designed for interactive and batch use within many domains and disciplines, such as engineering, computational fluid dynamics, medical science, material science and sensor data.
But what is visualization? Visualization is a powerful tool for displaying at complex, multi-dimensional data in a way that is easier to understand. Below are some examples.
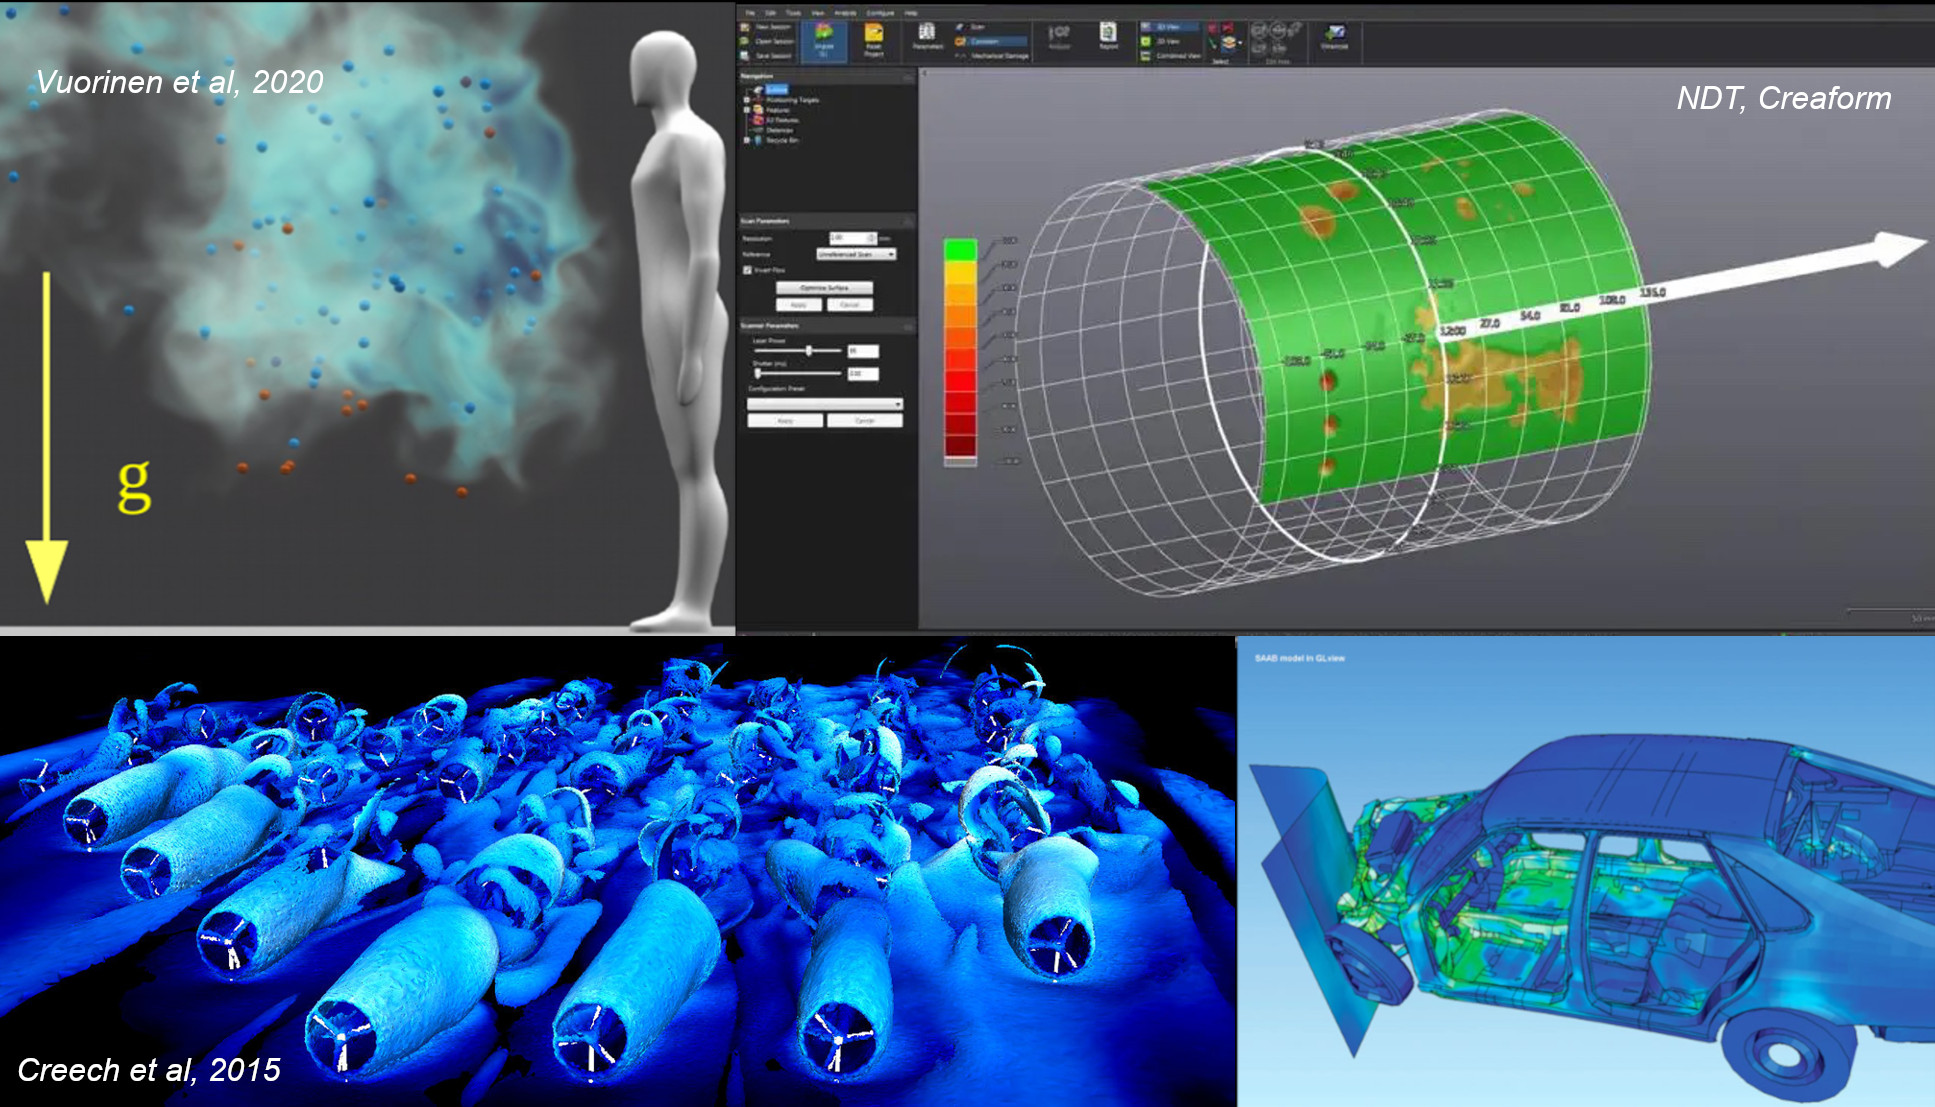
Paraview is capable of doing visualizations like you can see above - in fact, it was used to produce some of them. With practice, you can too. This lesson will help you get to grips with the basics of Paraview, and set you on the road to creating your own visualiations.
How Paraview can be run
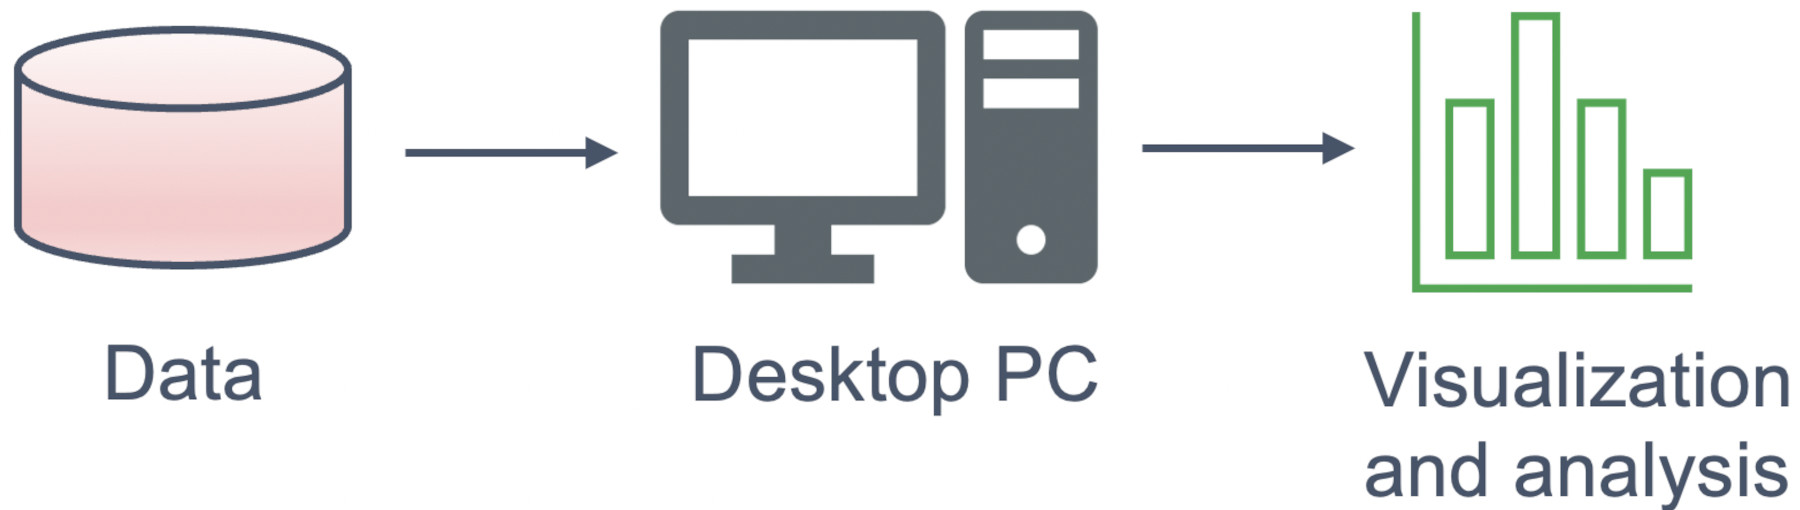
Paraview can be run straight from a desktop, reading data in directly from storage:
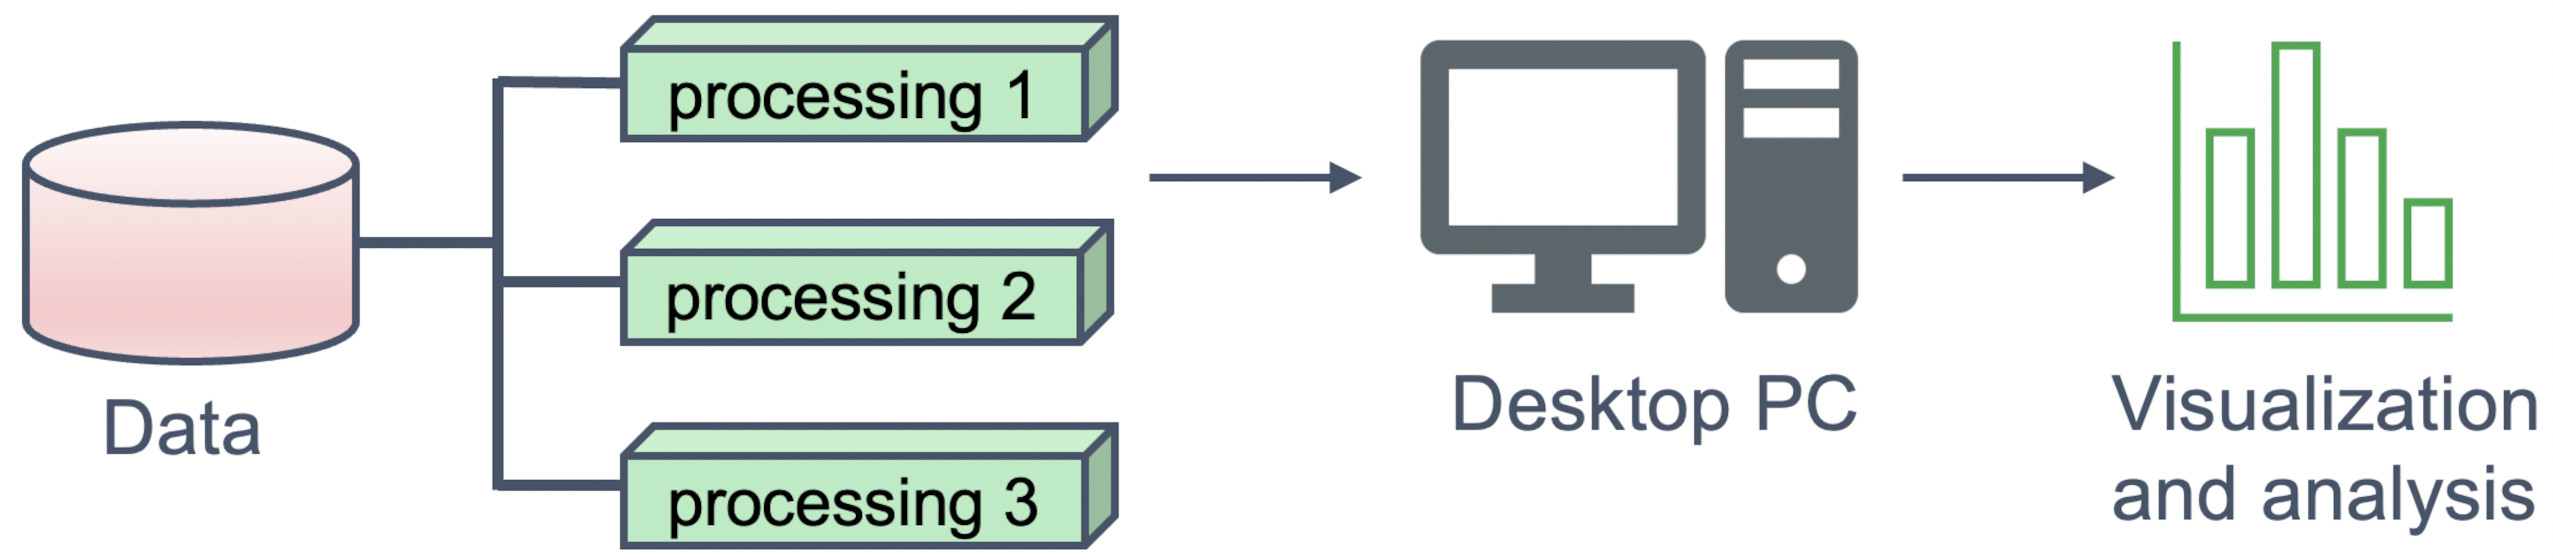
Alternatively, for very large datasets, Paraview can be run in client-server mode, with processing done remotely on a cluster or more powerful server computer, but rendered on a local desktop:
Processing data with filters
One of the most powerful features in Paraview, is that it can chain together a series of operations known as filters to operate on data. Filters can be connected in series, taking input from the previous filter’s output, operate on it, and pass it to the next filter.
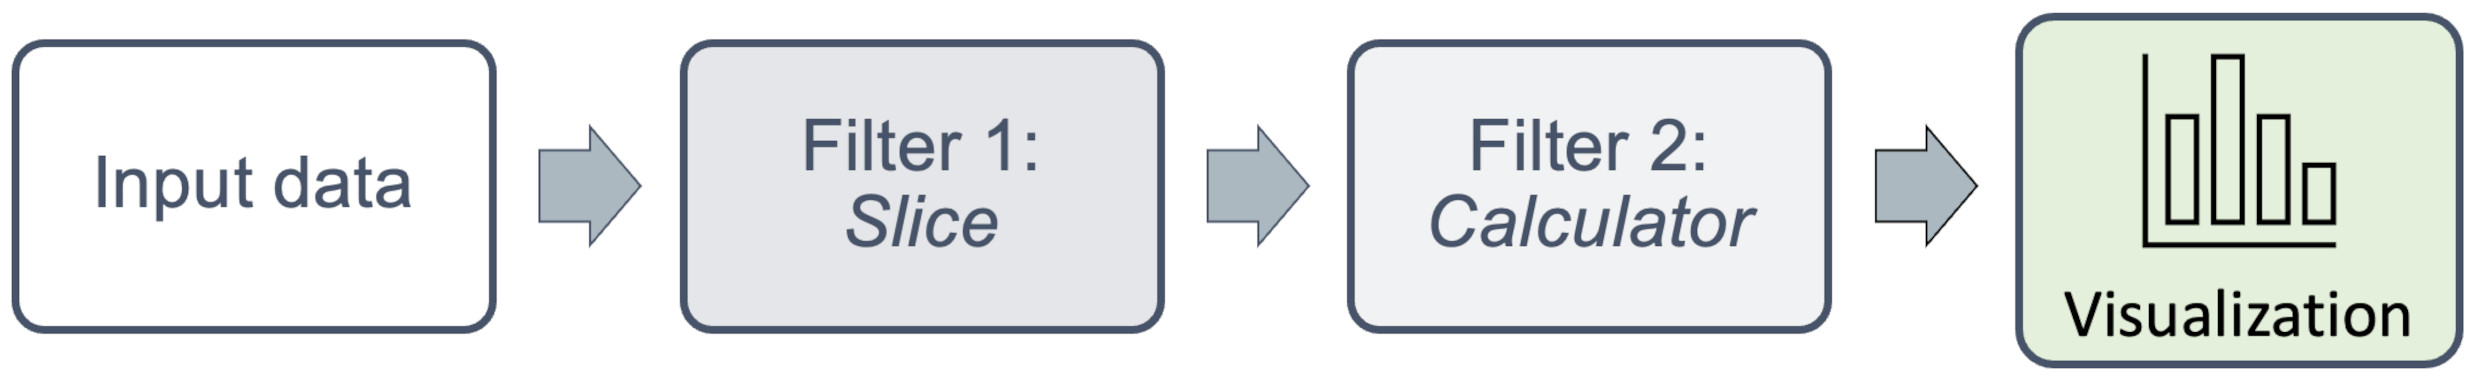
You can also `branch off’ the chain, with seperate filters to create multiple visualizations.
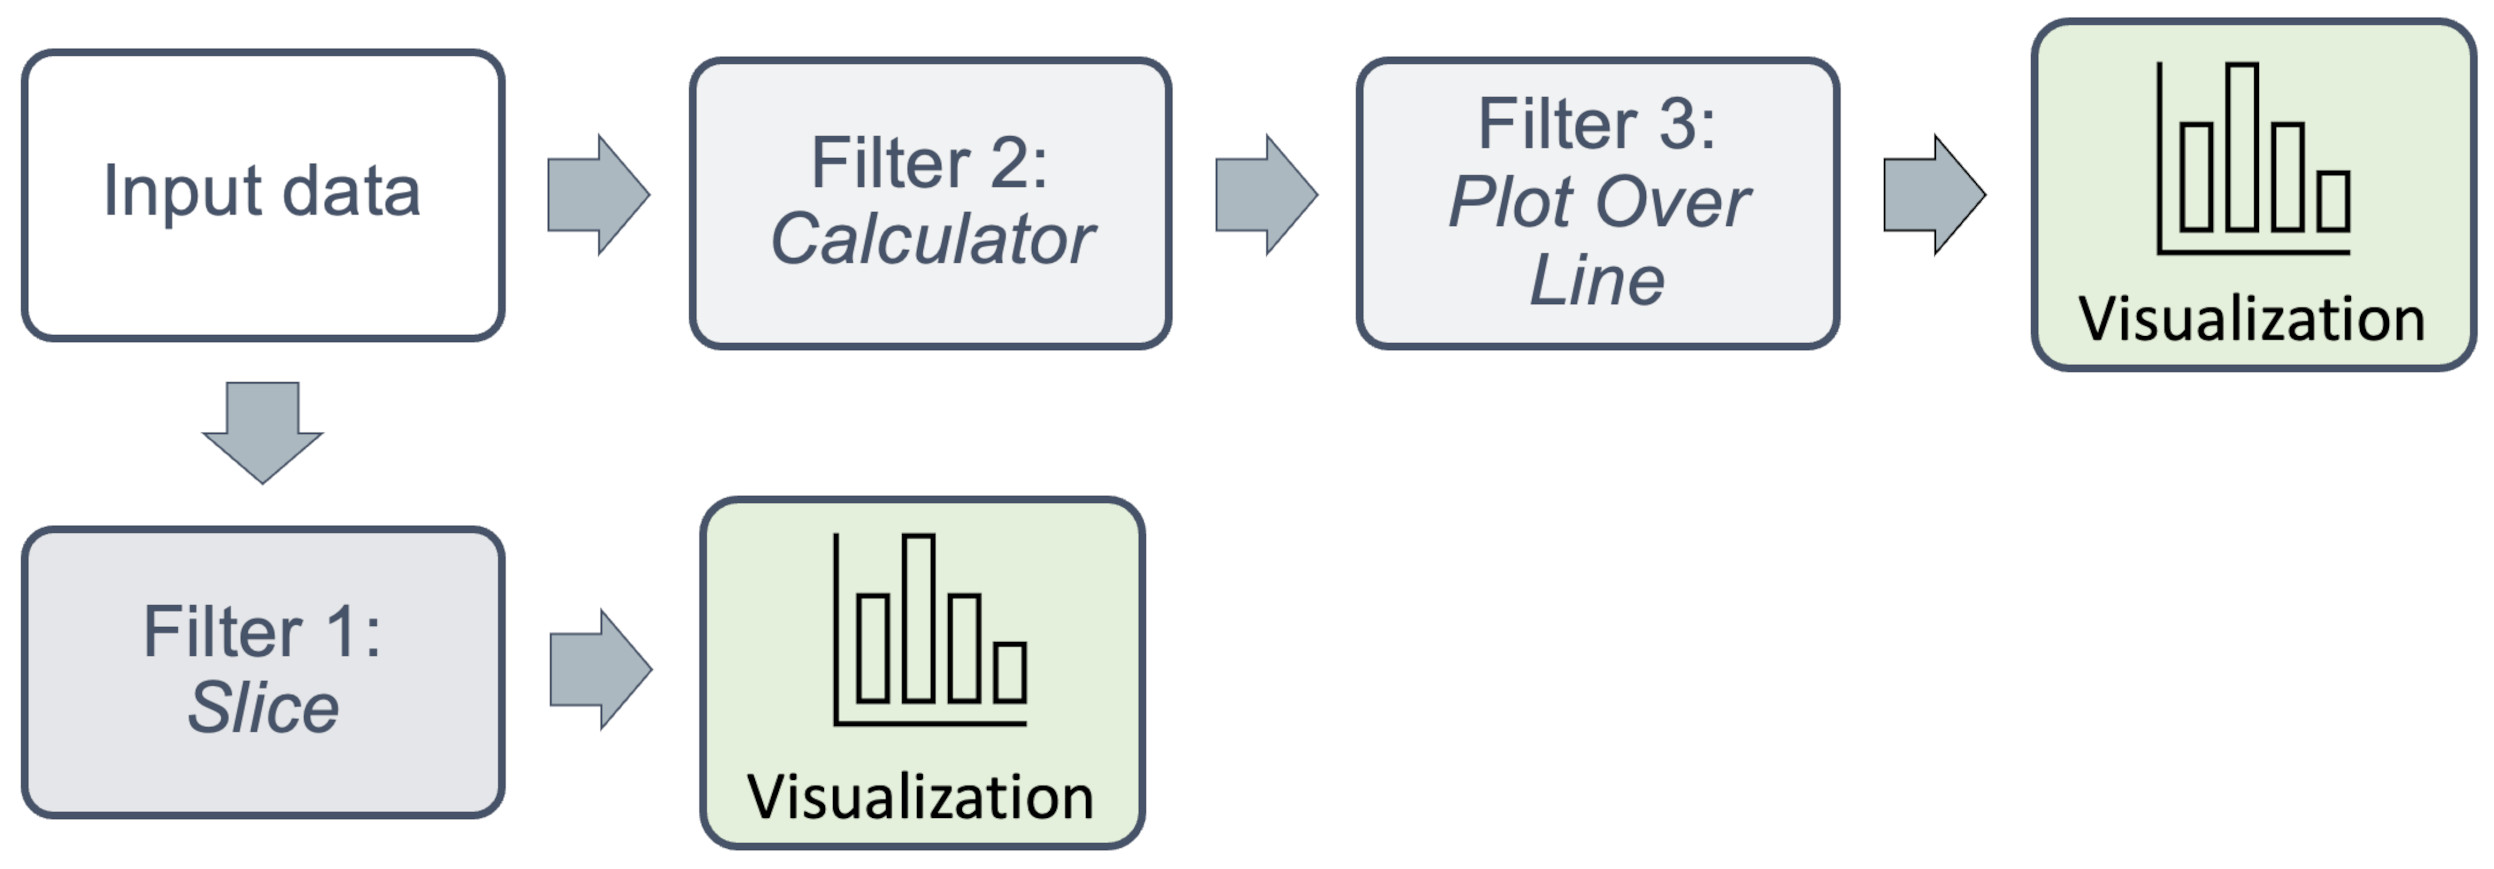
Each visualization appears in a seperate window frame within Paraview. What is particularly powerful, is that data from each can also be operated on, or saved individually to disc for further processing, eg. by a seperate application such as MatLab or a Python program.
Sources
Sources in Paraview are sources of data, which can be operated on by filters. This can be a file, or any item in the Sources menu, such as text, shapes, point or line sources. Some filters can combine sources together. This can be particularly useful in when restructuring data onto different grids, for example.
A few examples of types of data that Paraview can use are shown below.
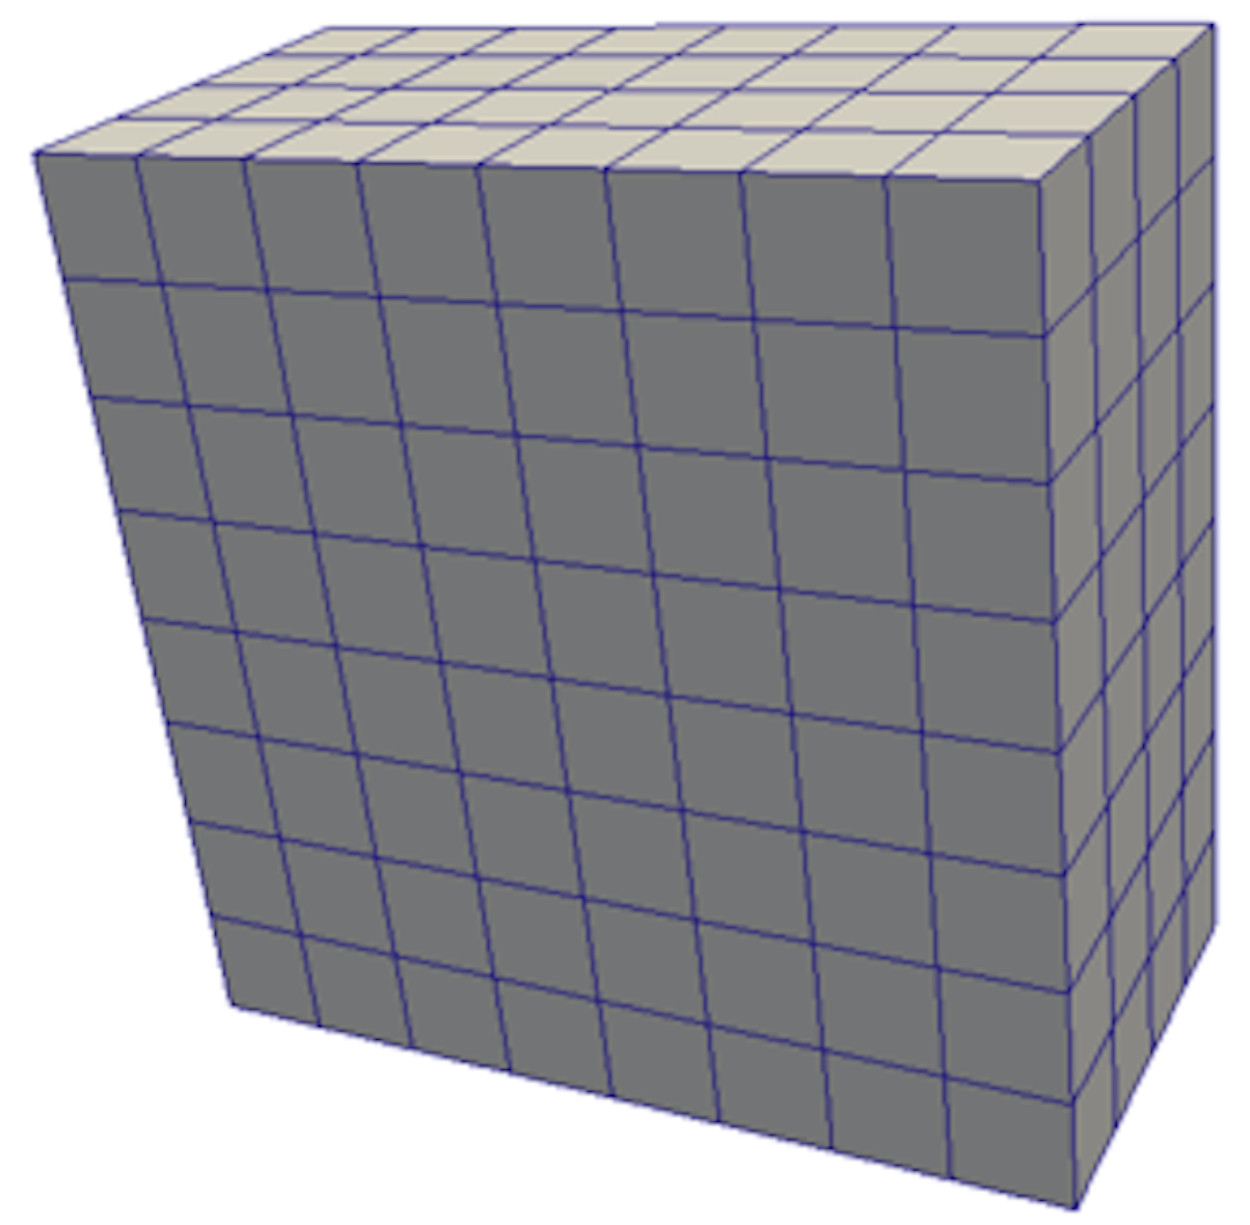
Structured grids
Structured grids have a regular, specified structure. Grid cells can be evenly spaced along the Cartesian axes, as is the case with the rectilinear uniform grid shown below.
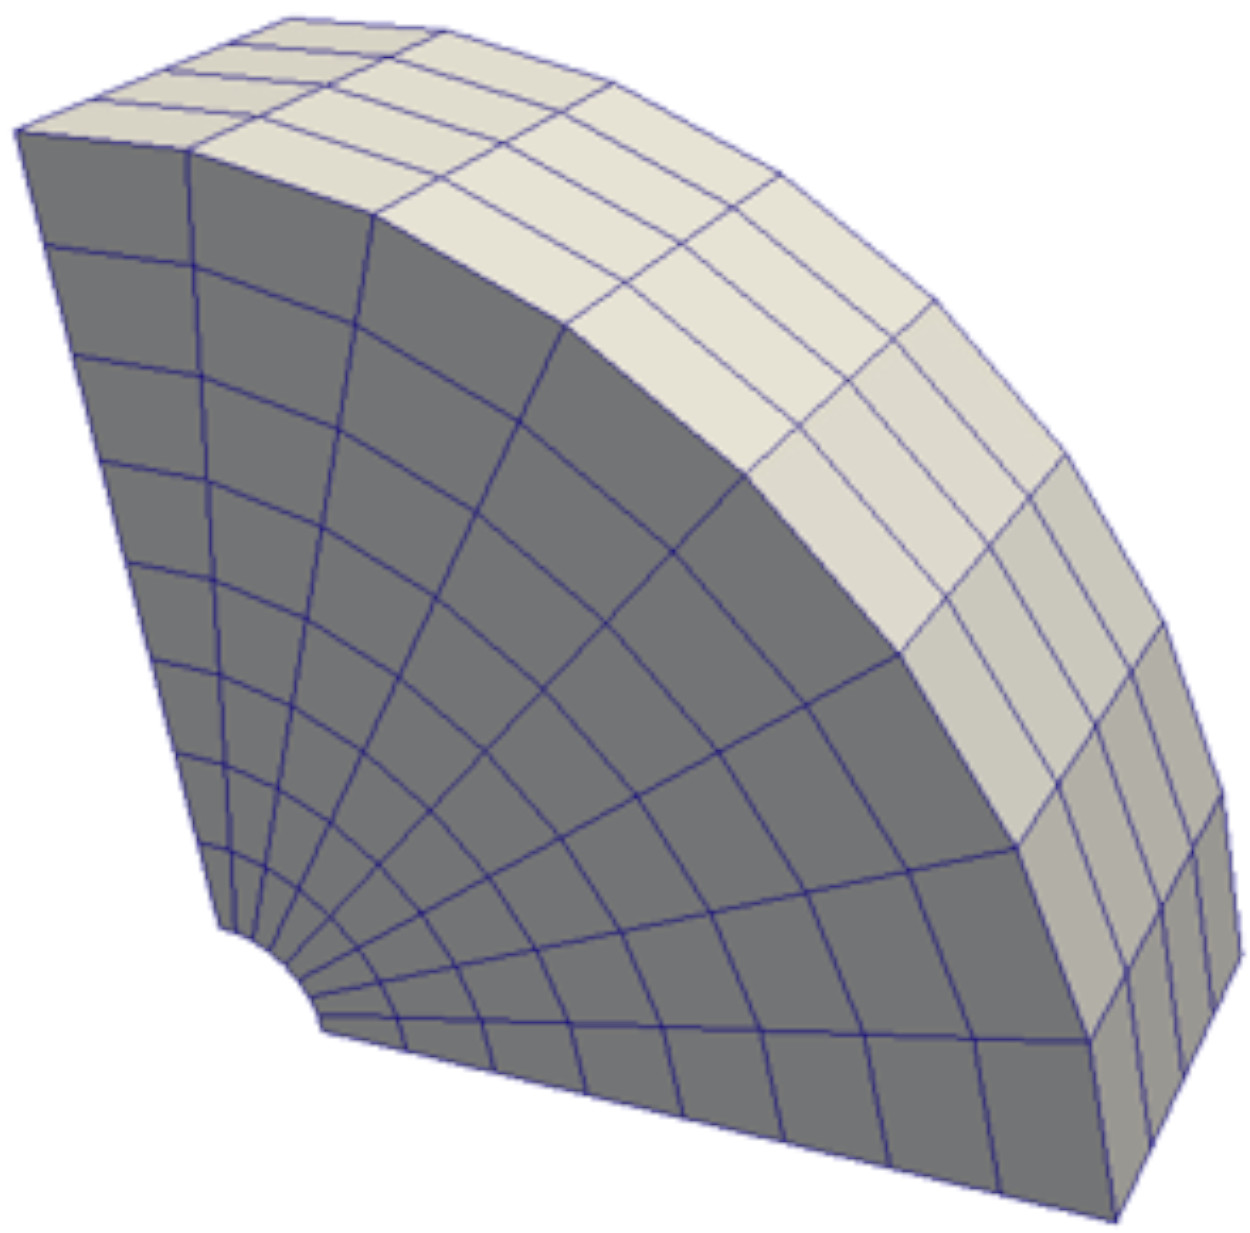
Or fitted using a cylindrical coordinate, as shown with the curvilinear structured grid below. Such a grid would typically be used to model a regular, tubular domain (eg. flow through a pipe).
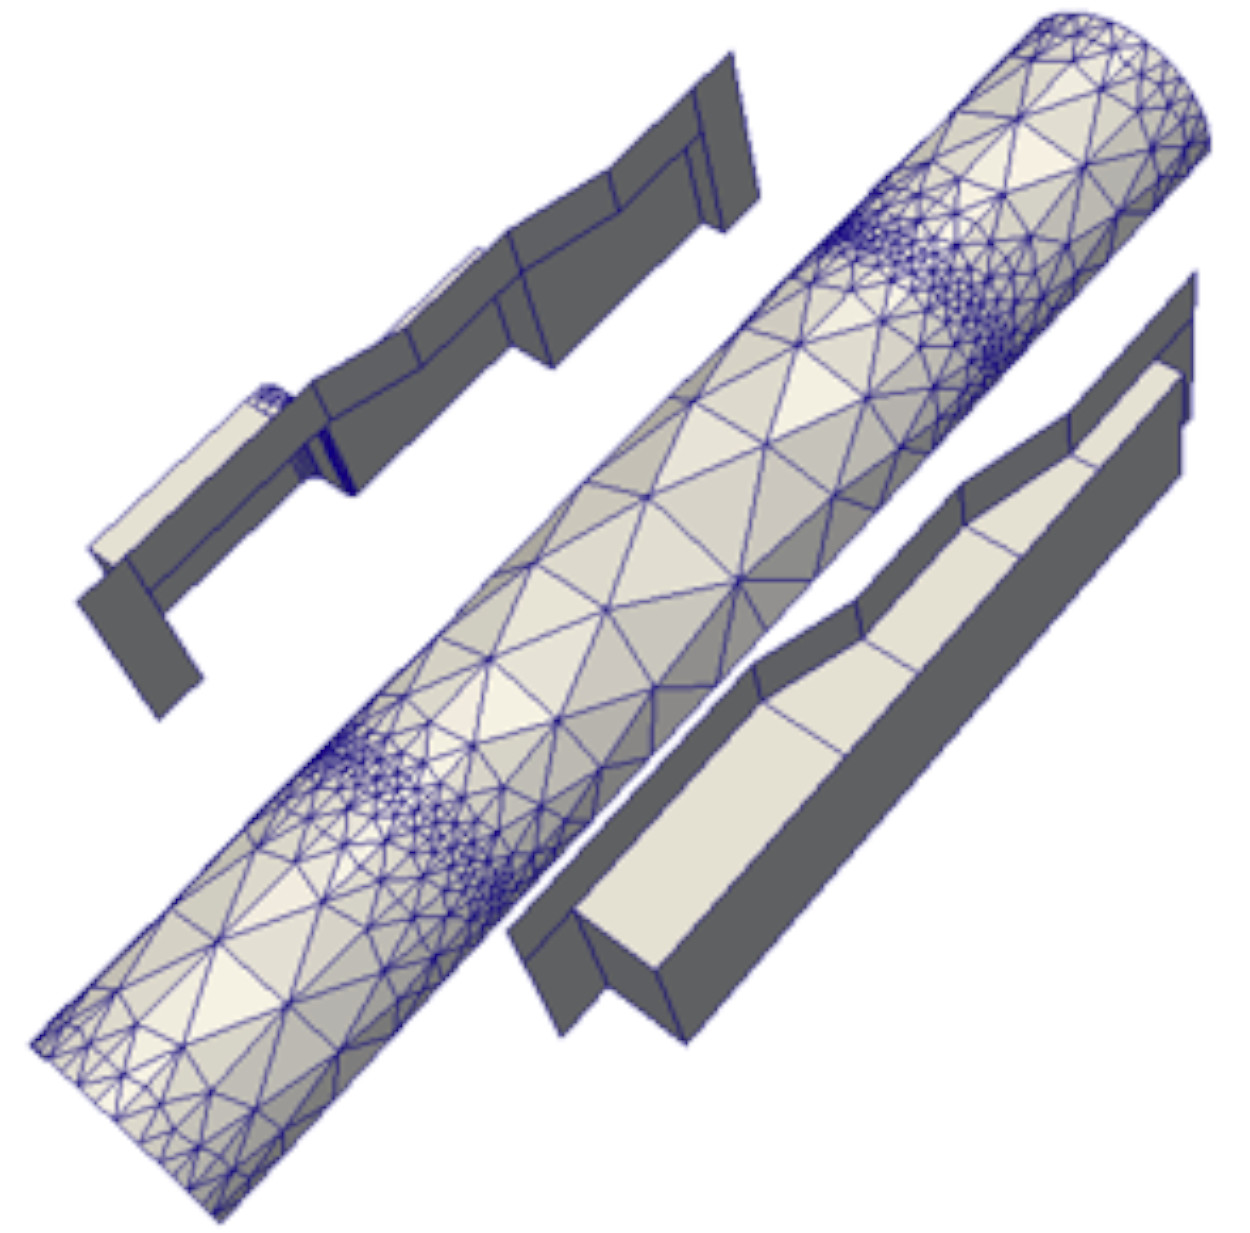
Unstructured grids
Unstructured grids have an arbitrary structure, which is completely dependent upon the meshing tool used to generate the mesh. They can be made up of arbitrarily-sized simplex shapes, eg. triangles, tetrahedra, hexahedra, or can be a mixture of multiple types, as shown here.
Paraview can operate on all 2D, 3D meshes without difficulty. The same types of processing can be applied to both structured and unstructured meshes, as long as the file format is supported.
Where to use Paraview
Paraview can be used in a variety of scientific, engineering and medical scenarios. There are covered in ACENET’s presentation High Performance Computing and Visualization: An Overview, which we will briefly recap here.
Key Points
Paraview is open-source visualization software
It loads in structured and unstructured 3D datasets of scalar and vector data.
It is available for Windows, MacOS and Linux