Introducing filters
Overview
Teaching: 20 min
Exercises: 10 minQuestions
How do I filter data?
Can I show multiple views?
Objectives
Attaching a filter to an opened file
Chaining filters together
Changing the order of filters
Overview of filters
A filter is a processing unit that takes data from a data source or other files, and produces output. Filters can be chained together, typically with the last in the chain shown. Filters can be branched off too, so one data source can have multiple filters independently operating on its data.
There are a great many filters available. Paraview categorises them in the Filters menu so you can find what you want easier.
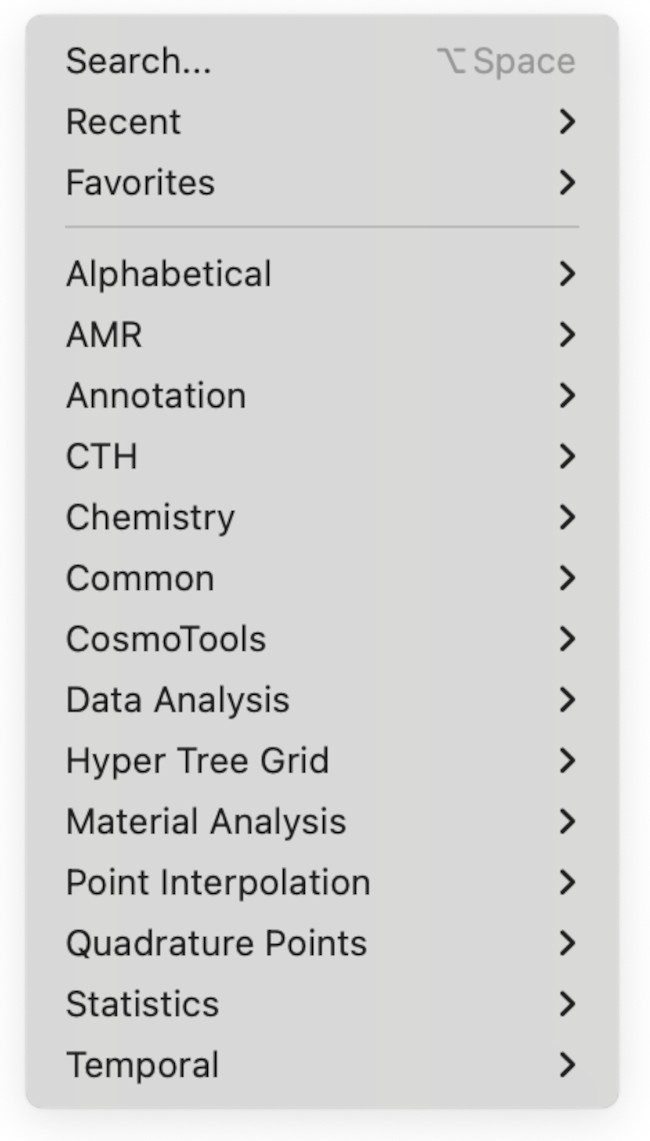
We will mostly dealing with those in the Common submenu.
Adding the first filter
We will start from where we left off in the previous lesson. Here, we are going to apply a filter to see is happening to the gas inside the chamber. We are going to do this by applying the Clip filter.
First, click on disk_out_ref.ex2 in the Pipeline browser and then go into the Common submenu in the filters, select the Clip filter.
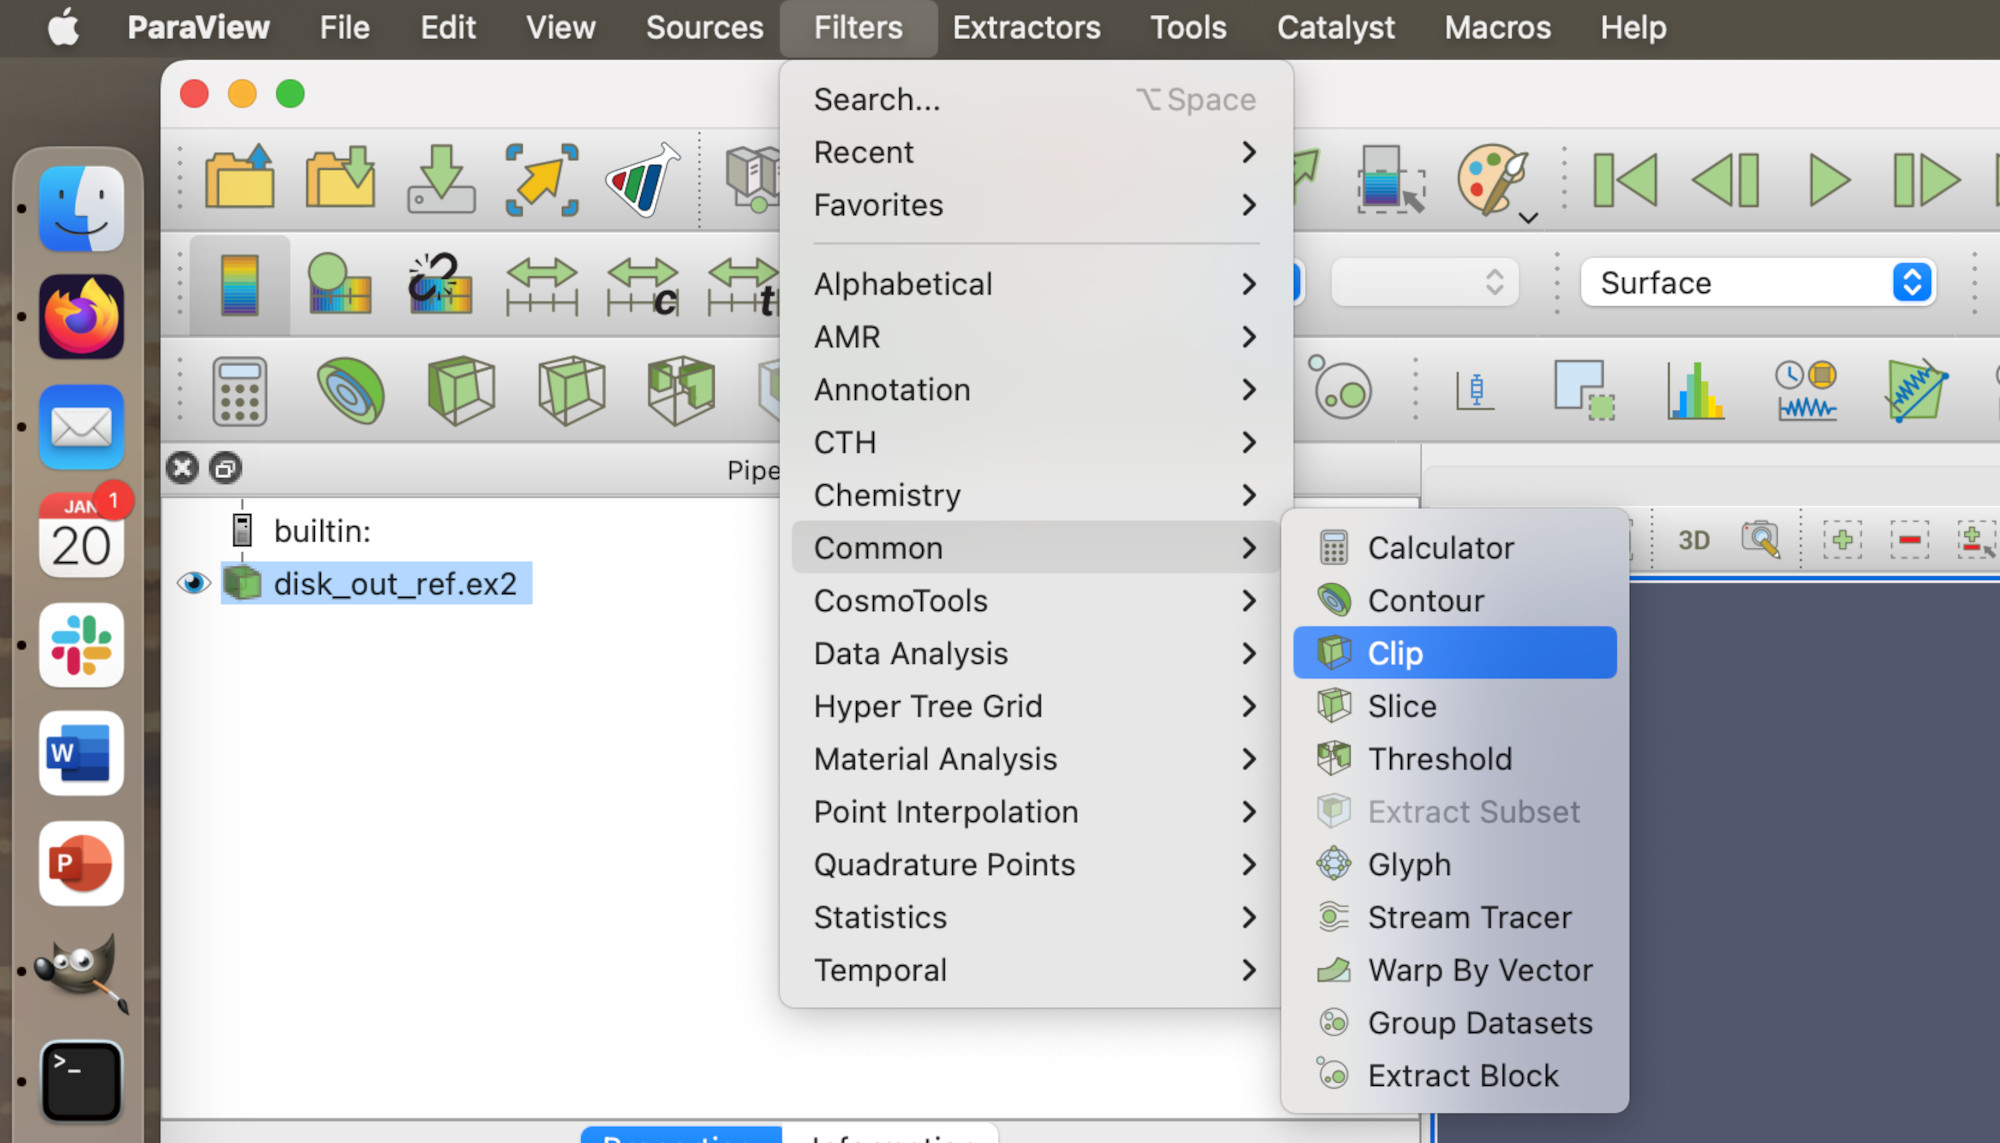
Click Apply. You should now see a render view similar to this.
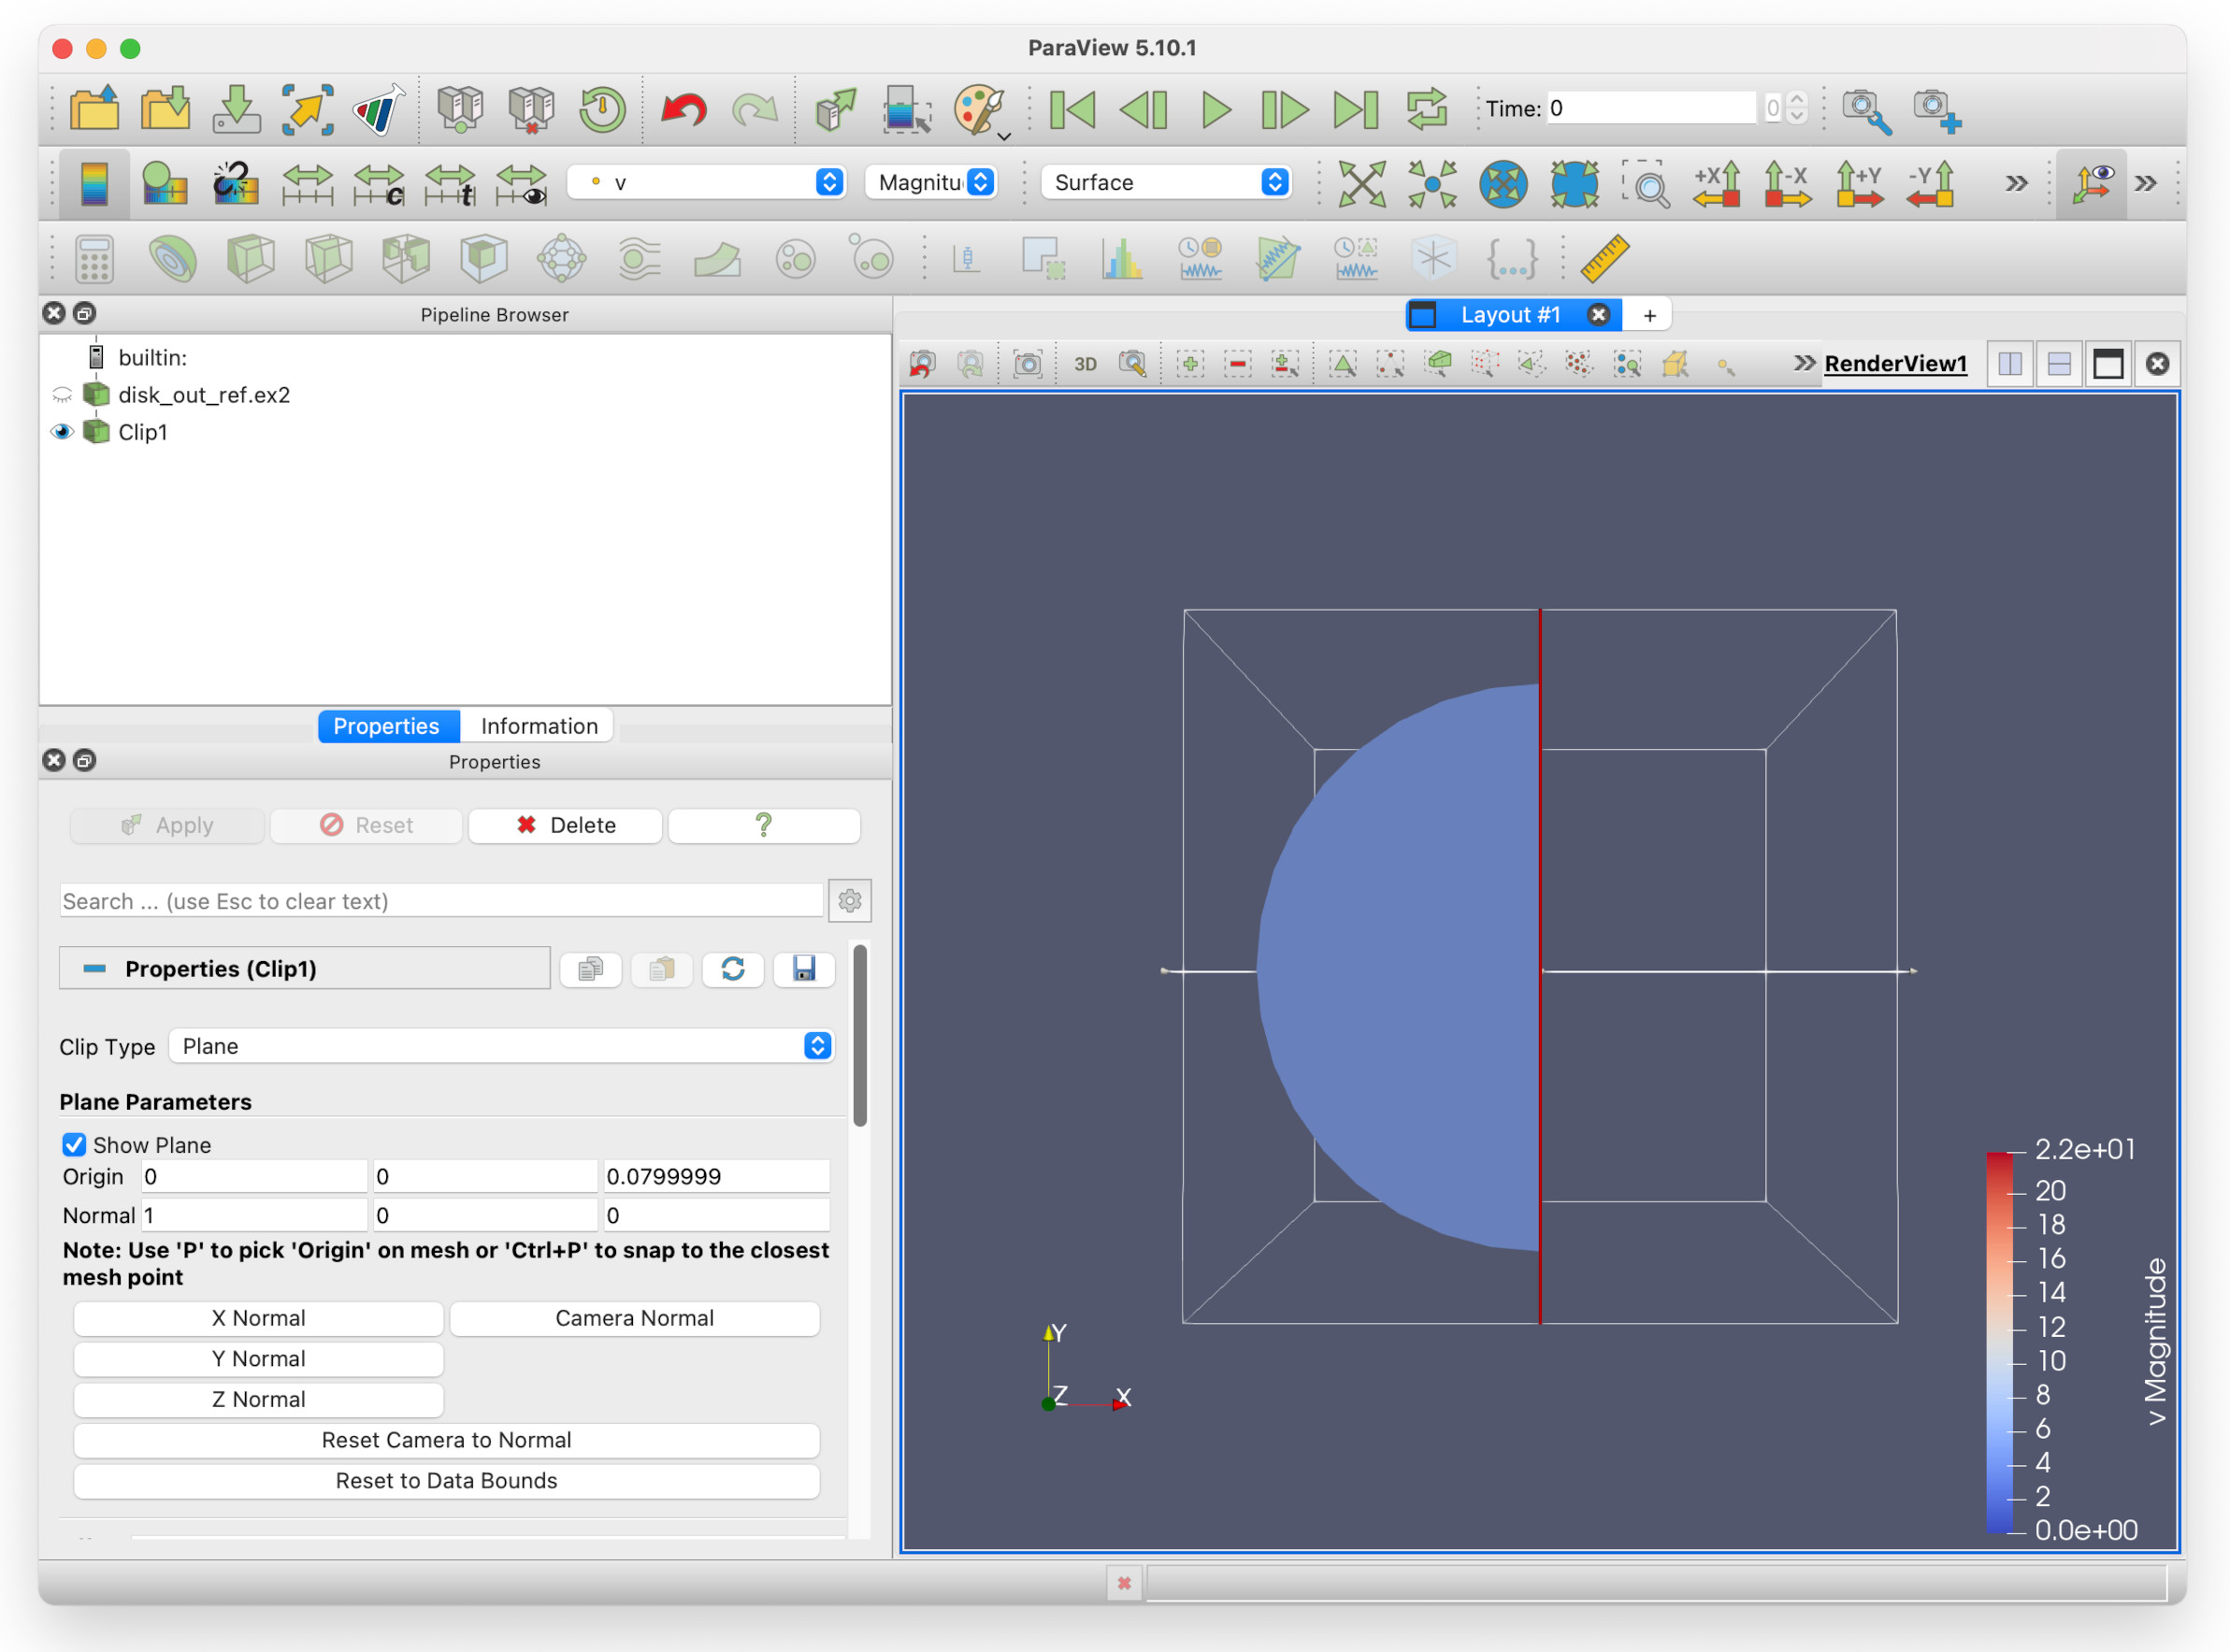
Note that in the Pipeline browser, disk_out_ref.ex2 has a greyed-out eye icon next to it, and Clip1 - our clip filter - has a solid black eye icon. This is to indicate that the view of disk_out_ref.ex2 is hidden from view. If you show wish to see it again, you can click the faded icon to show it - however, this will obscure the Clip1 view.
Next, we will rotate the view so we can see the fluid velocity within the chamber. You can do this in one of two ways:
- Rotate the view with Left mouse click and drag as shown previously, or
- Hit the -X rotation button in the toolbar.

Which should give you this:
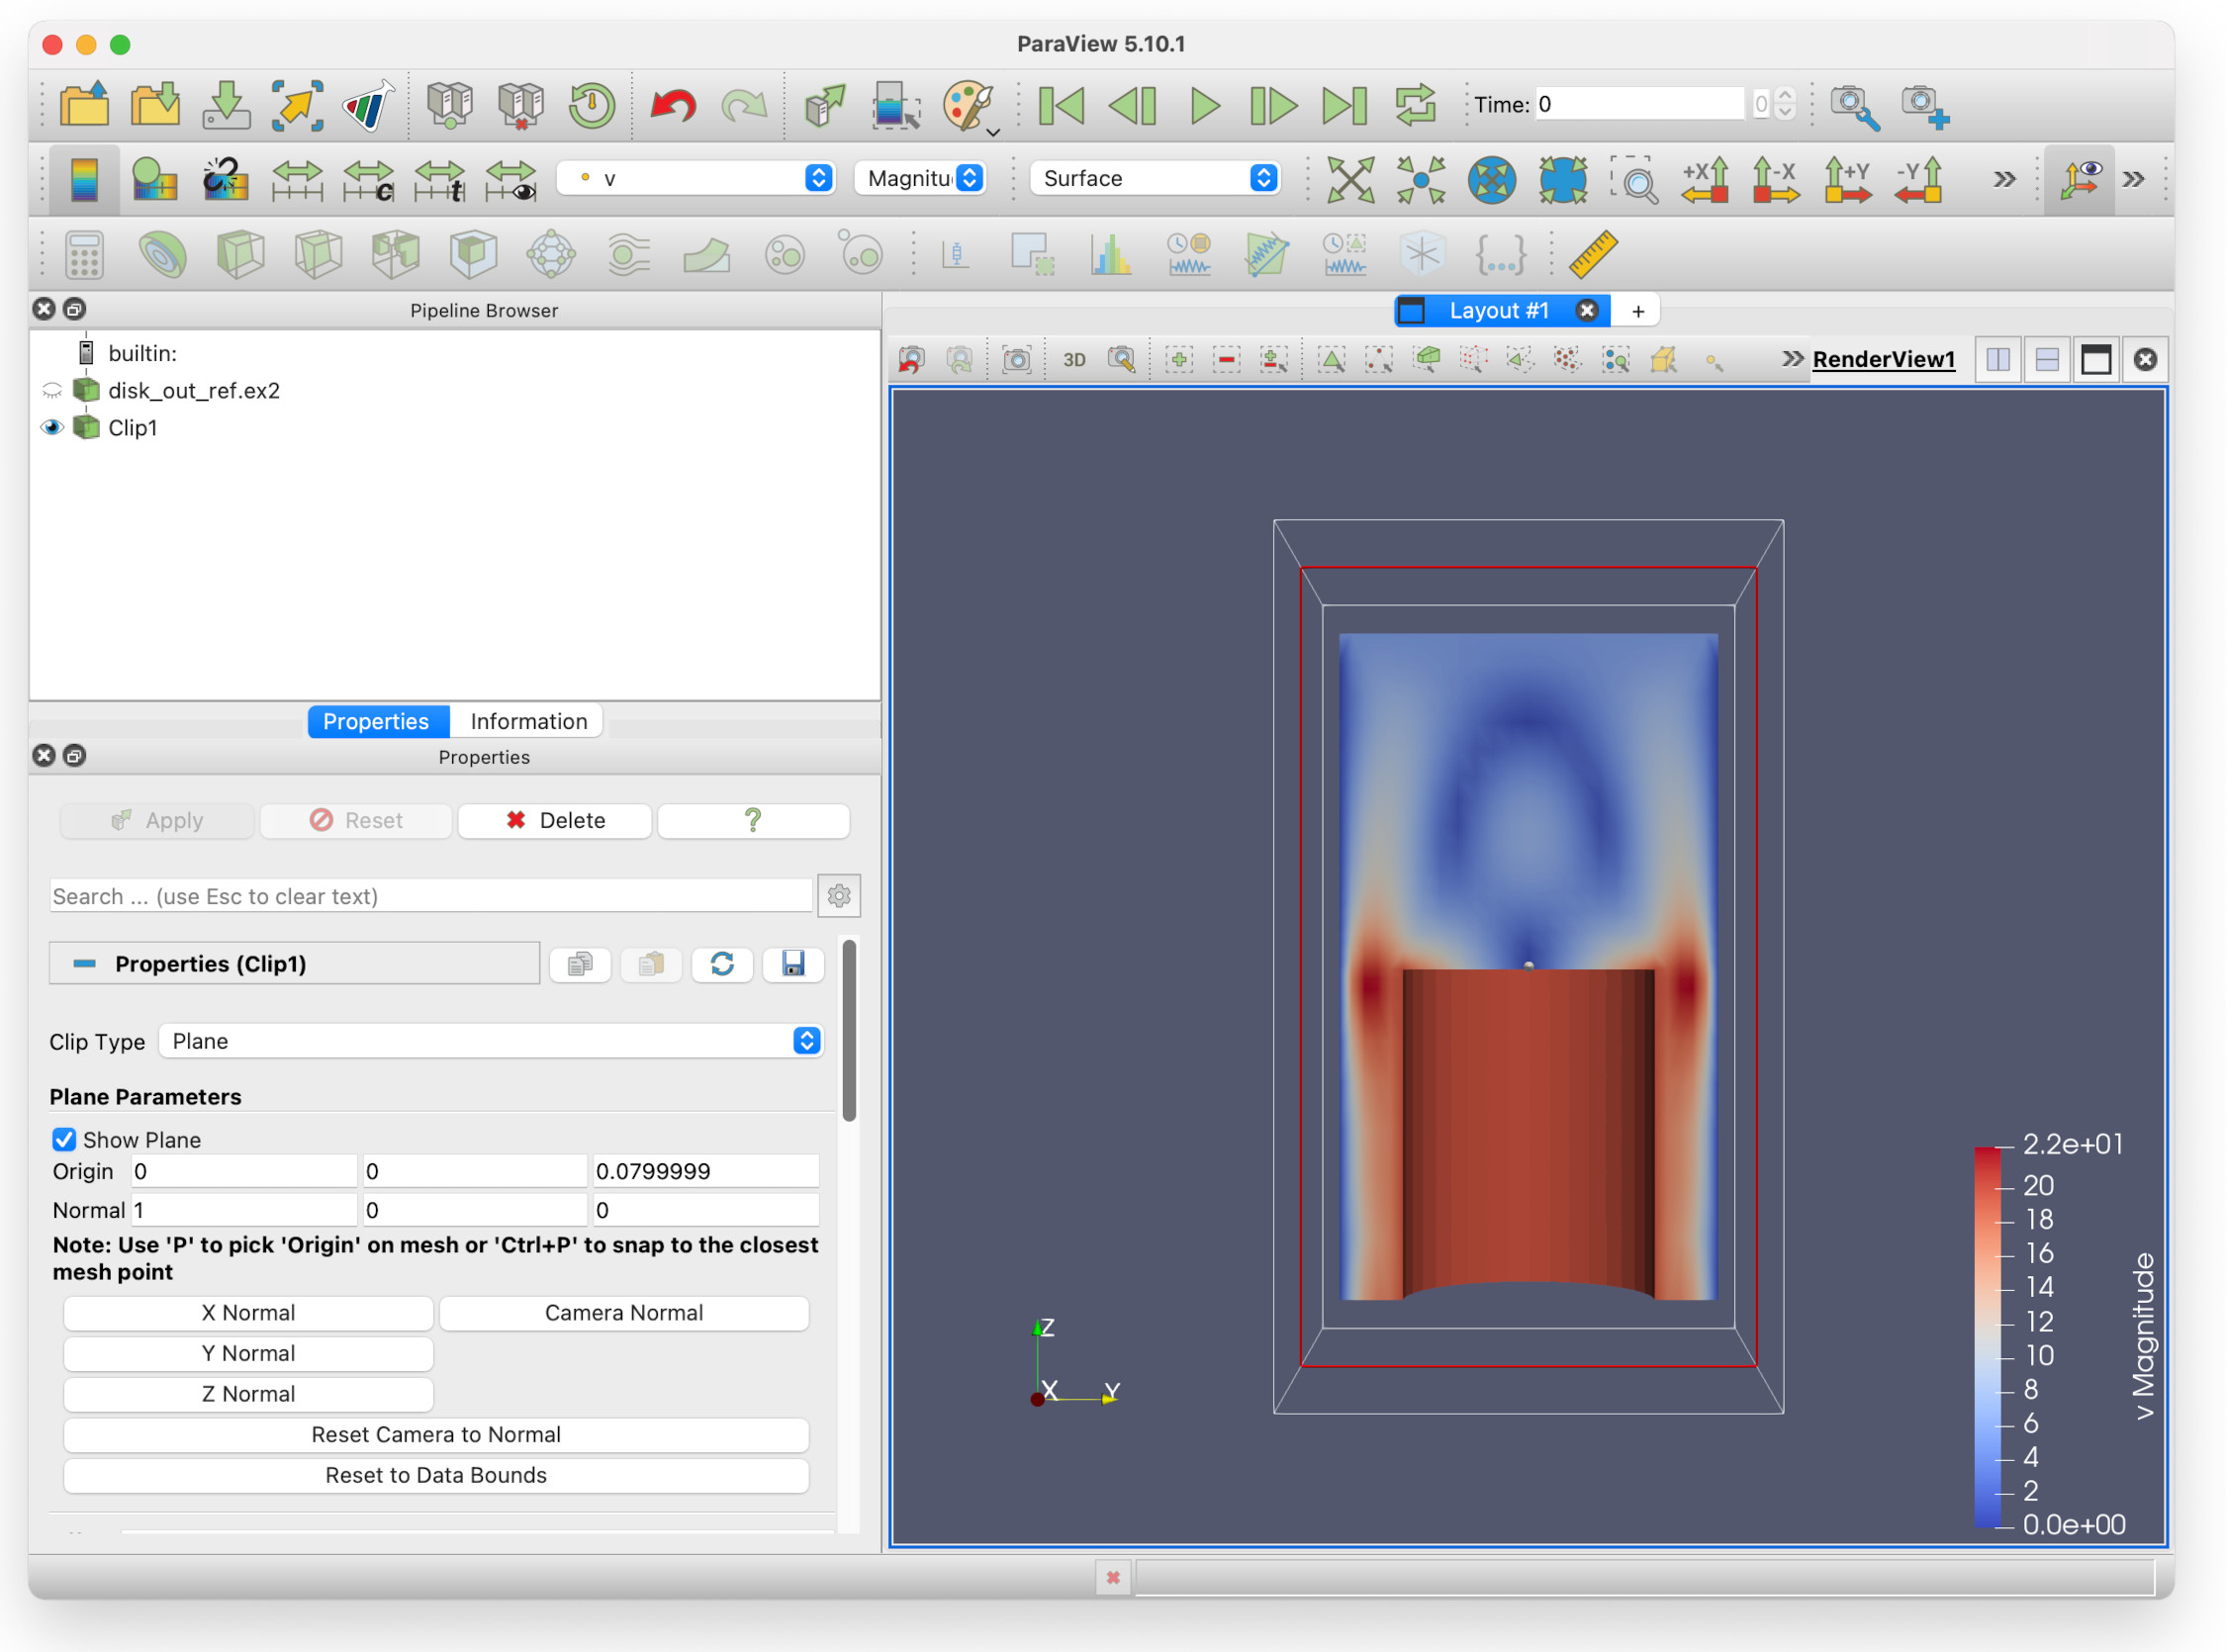
You can see that fluid speeds up and moves around the sides of the piston, which is what we would expect as it moves up and down. By looking at this picture, the physics of the situation can be clearly understood by a non-expert. This shows one of the many strengths of visualisation.
But what is happening to the pressure? How would we show that? Can we show it alongside the velocity?
Multiple filters and multiple views
Here we are going to do two things:
- Create a second filter
- Create a second render view to show the results of that filter
Creating a second filter
Go into the Filters/Common submenu and select Clip, then hit the Apply buttom. You will see the following view.
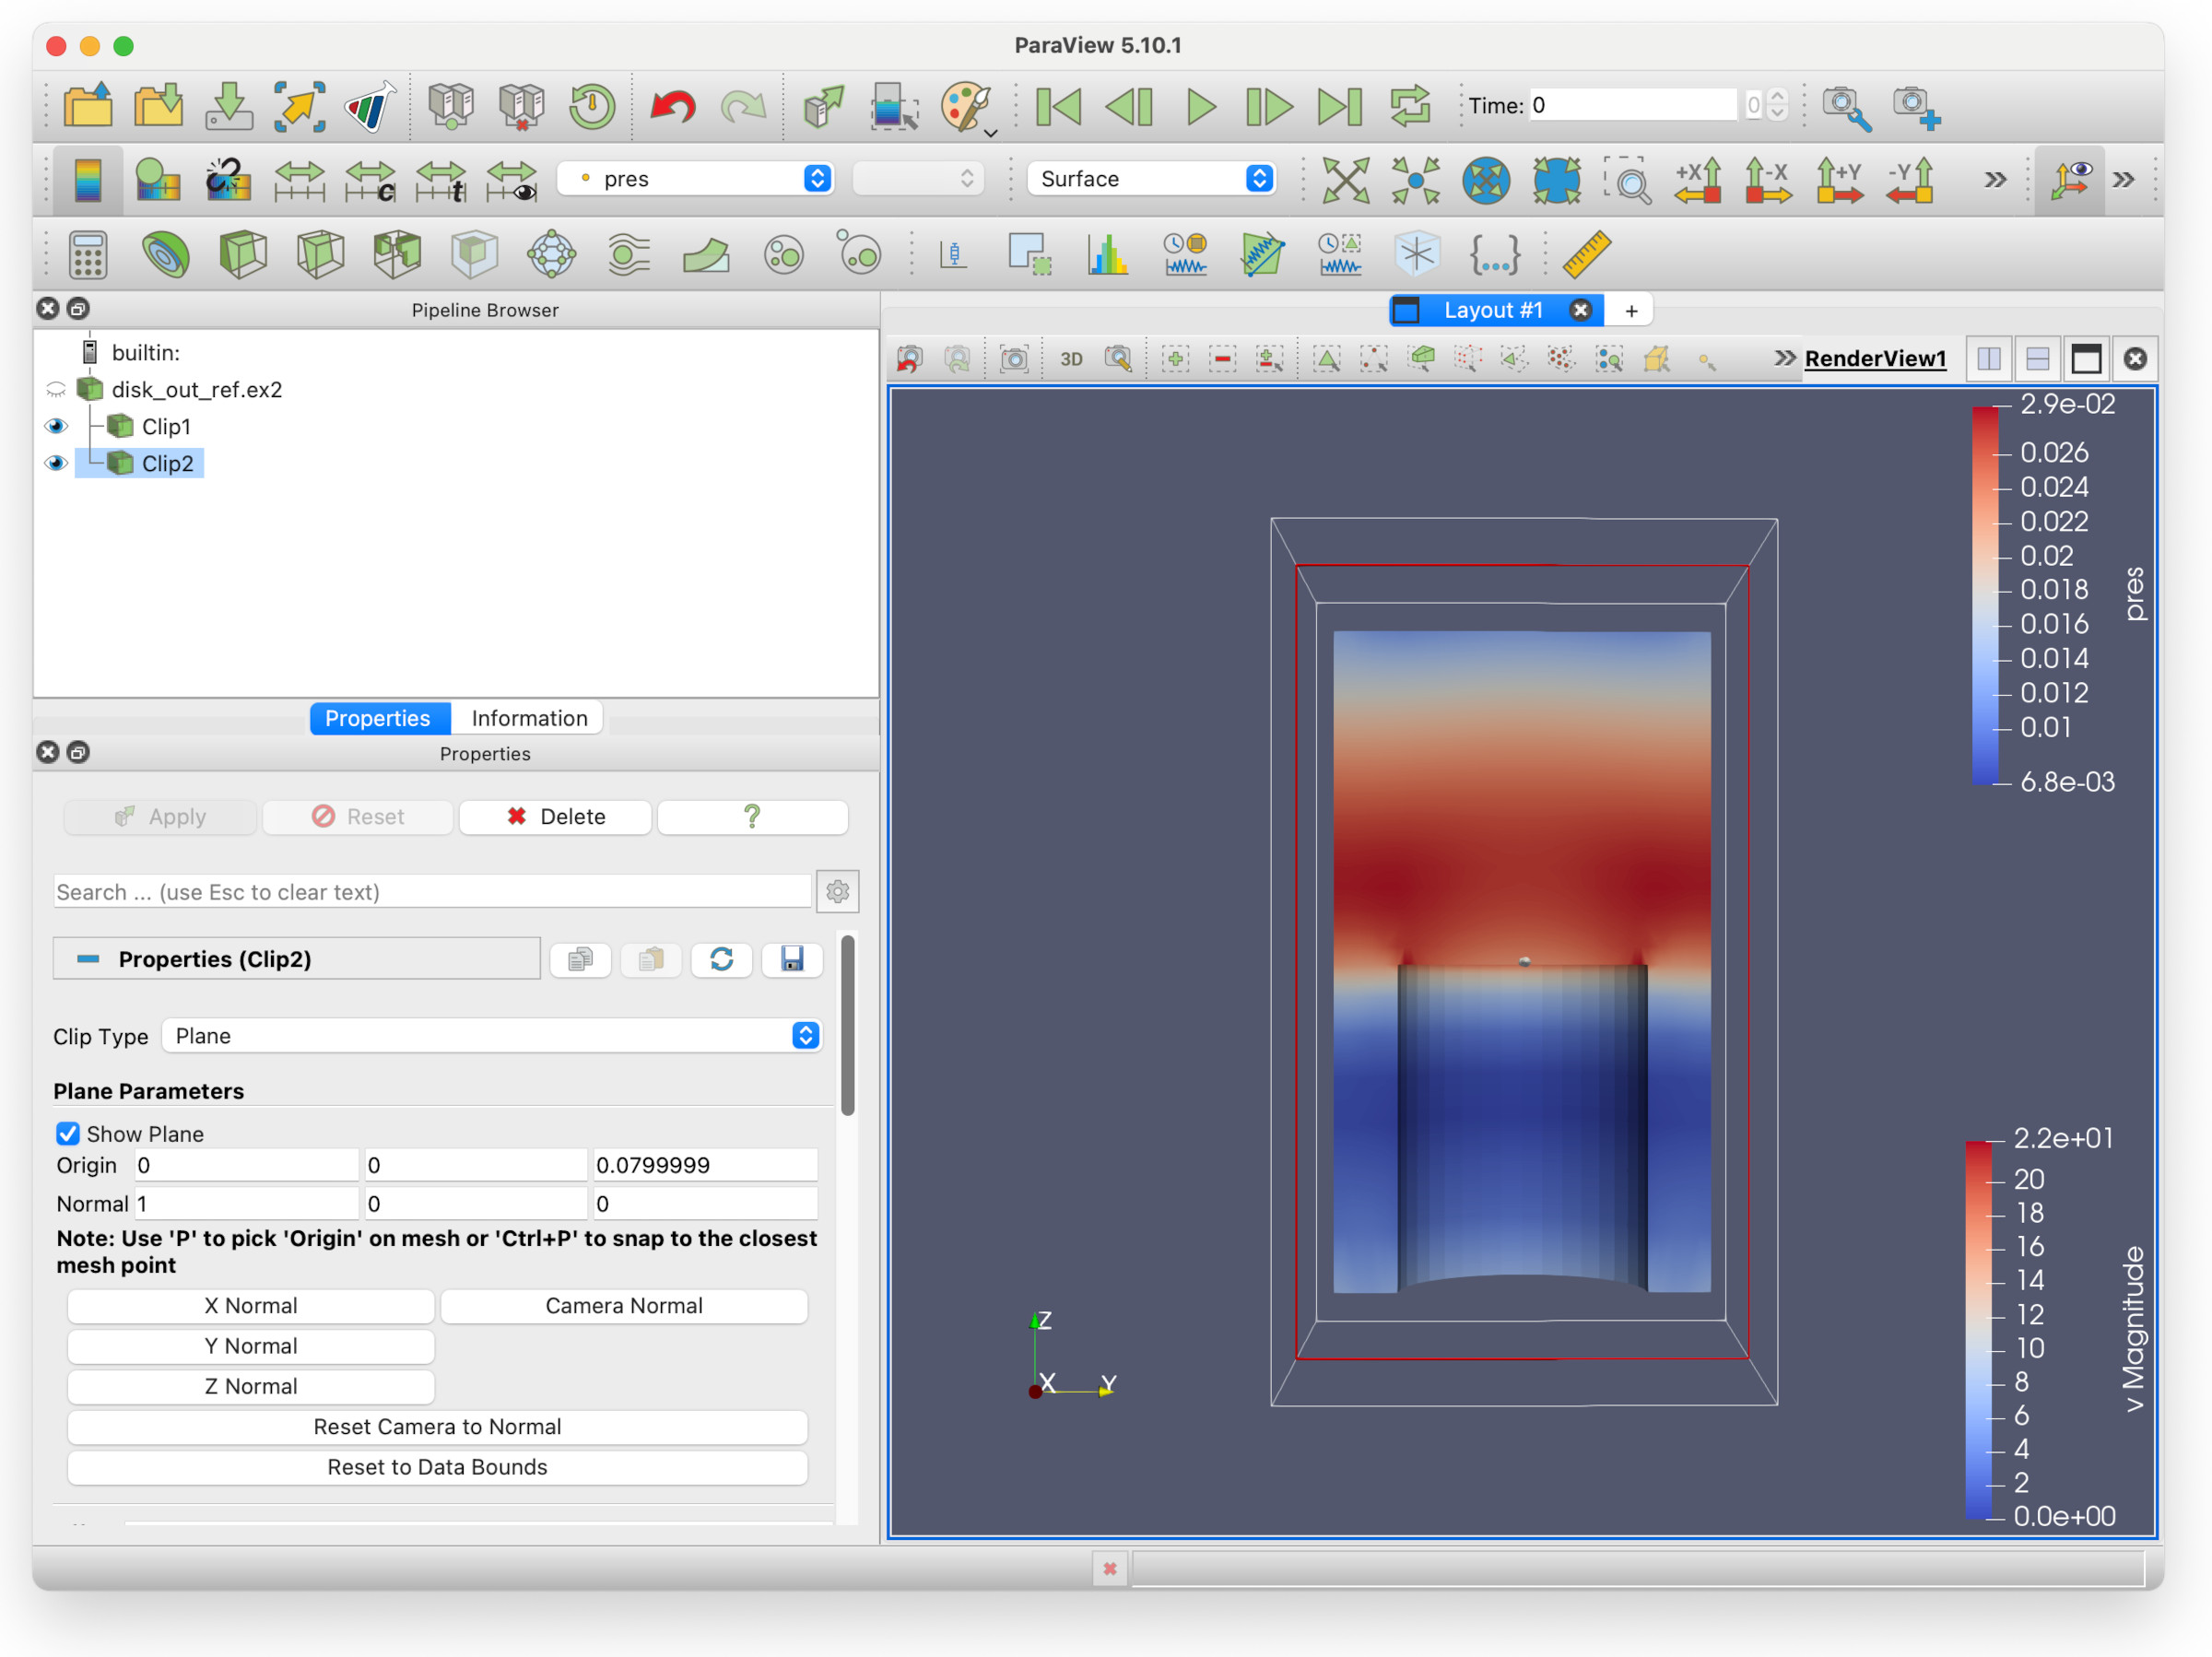
Notice that the colours have changed. This is because the view of the second clip (pressure) has obscured the first (velocity). This is what we are going to fix.
Firstly, Clip1 and Clip2 are ambiguous names. Let’s rename the filters so they cause less confusion.
- Right click on Clip1 and select Rename. Type `velocity’.
- Right click on Clip2 and select Rename. Type `pressure’.
Creating a second render view
Now we will create a second render view, in which we will show the pressure. This will allow us to look at both velocity and pressure of the fluid side-by-side.
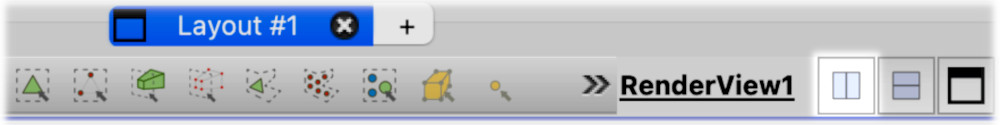
To the right of the RenderView1 label at the top the render pane, click on the vertical split icon.
You will see a second pane that asks you to Create view. Select Render View. You will now have two render views in the layout / render view pane:
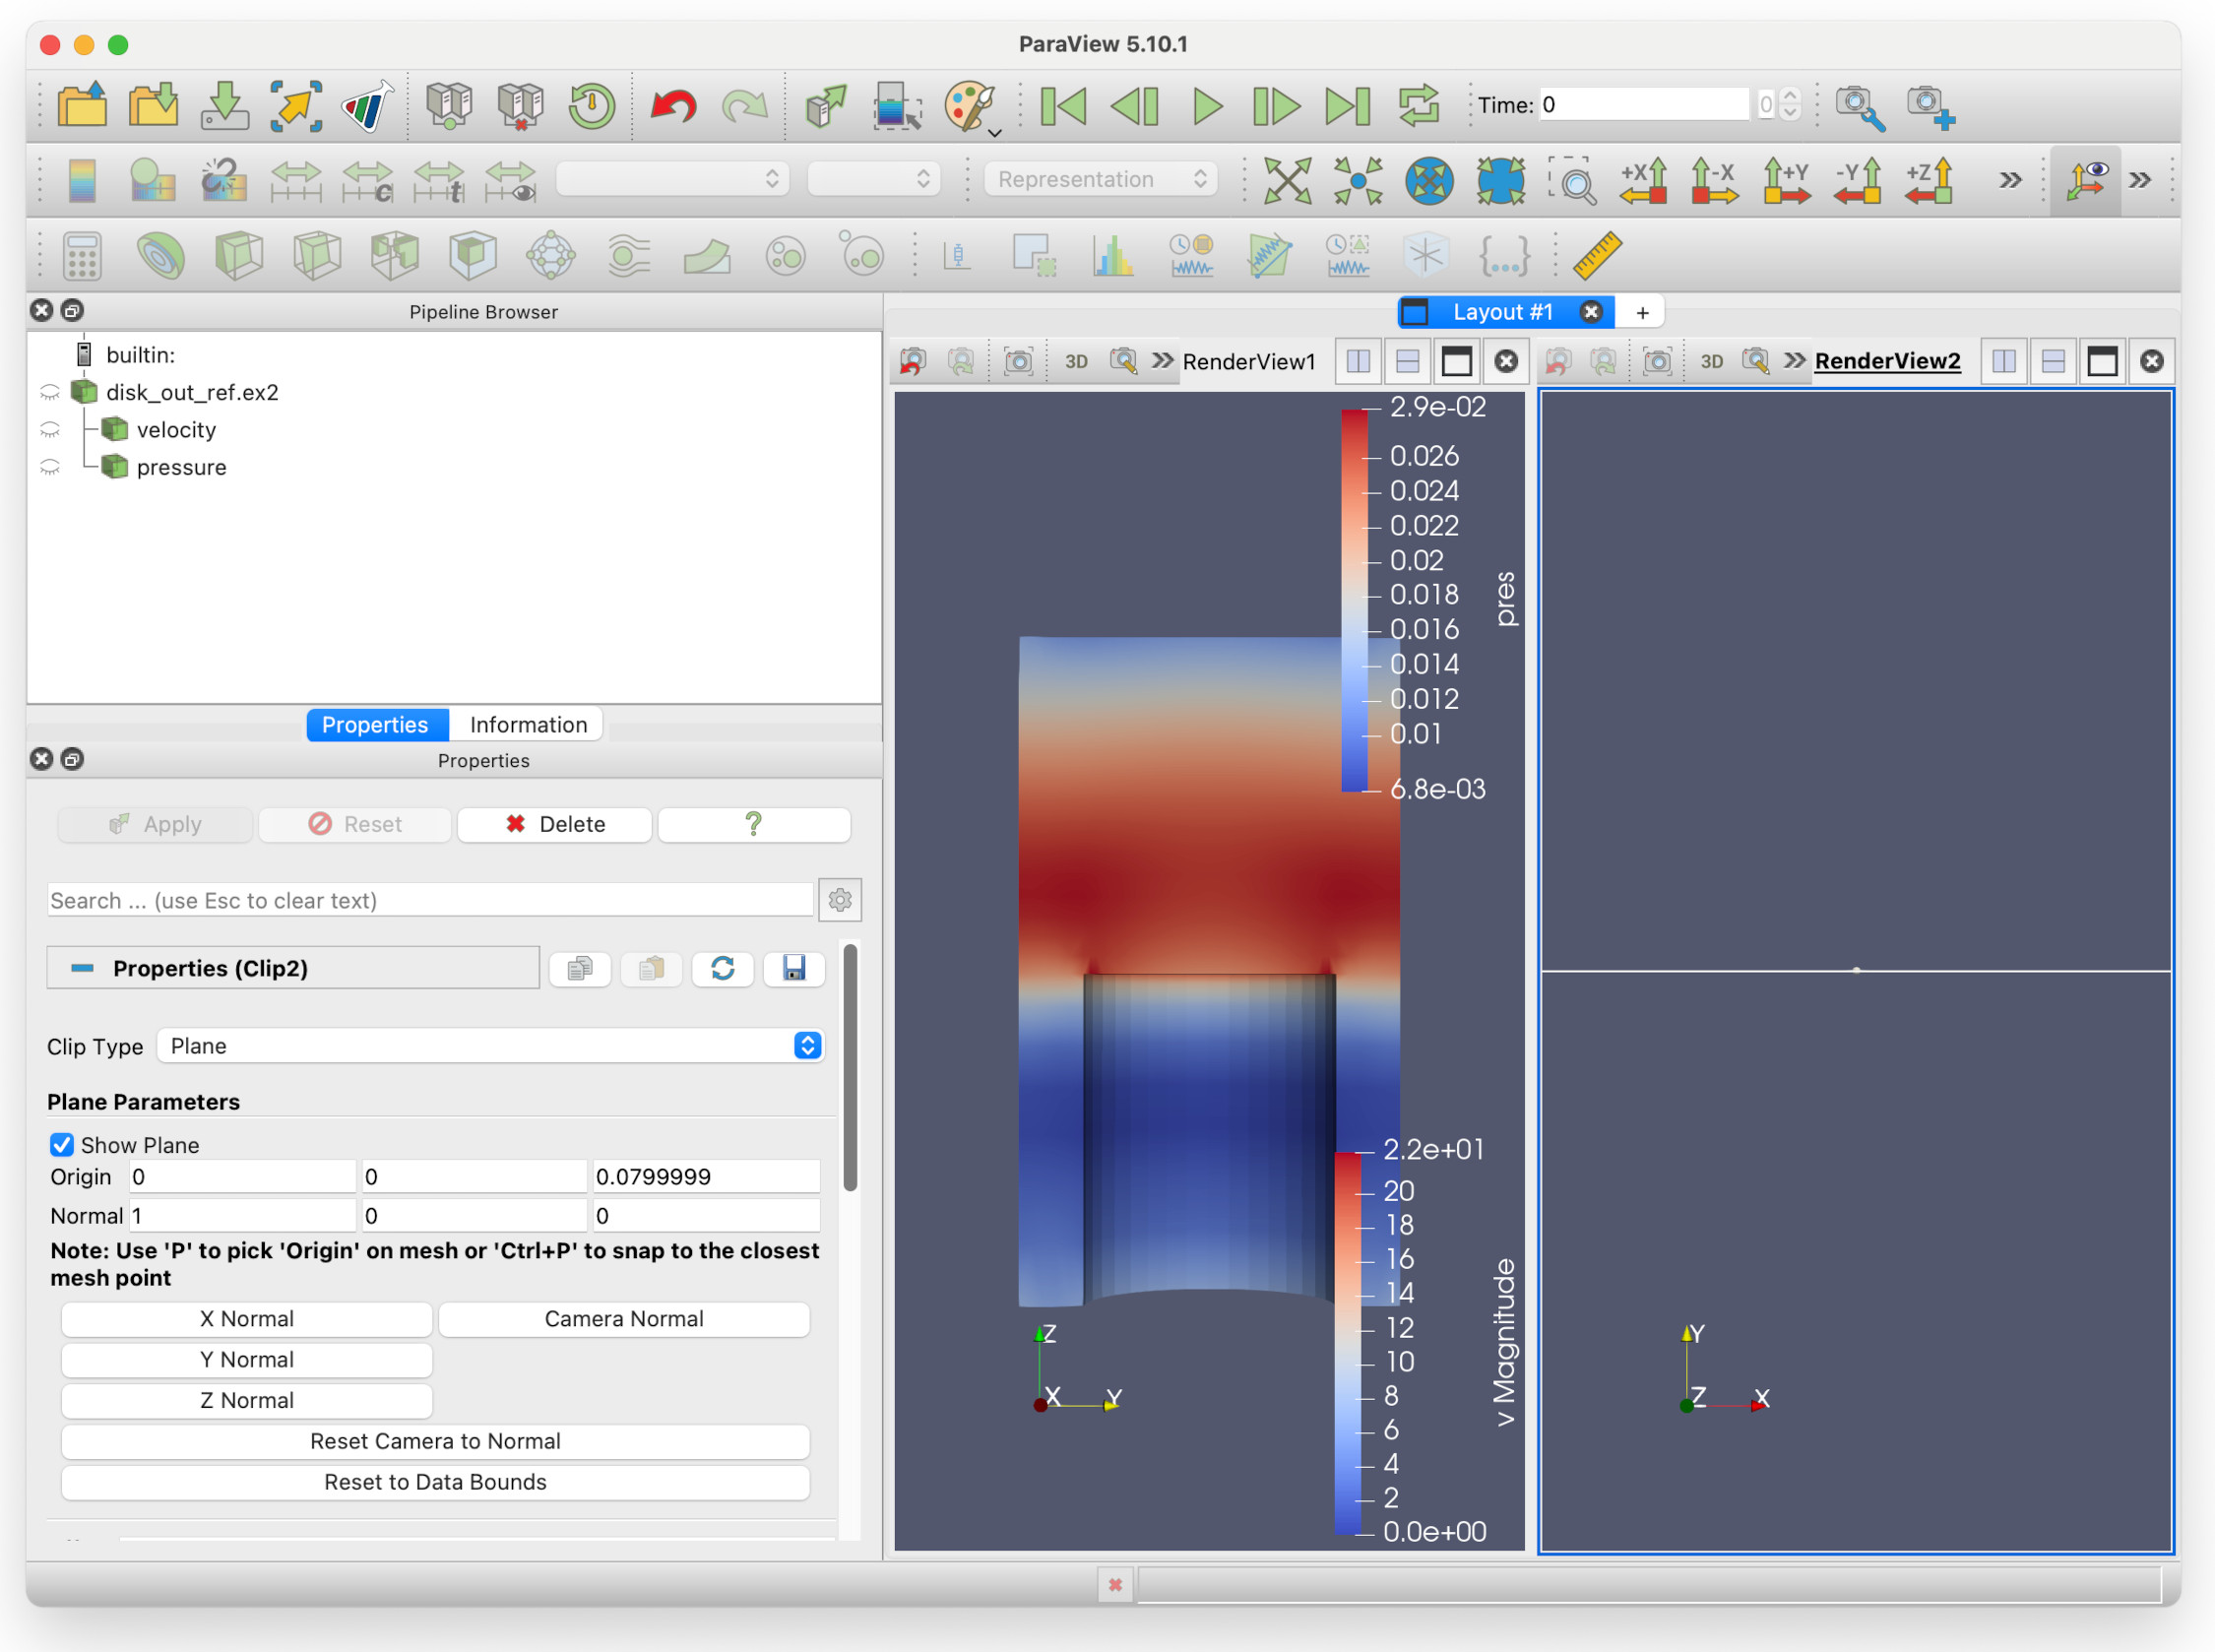
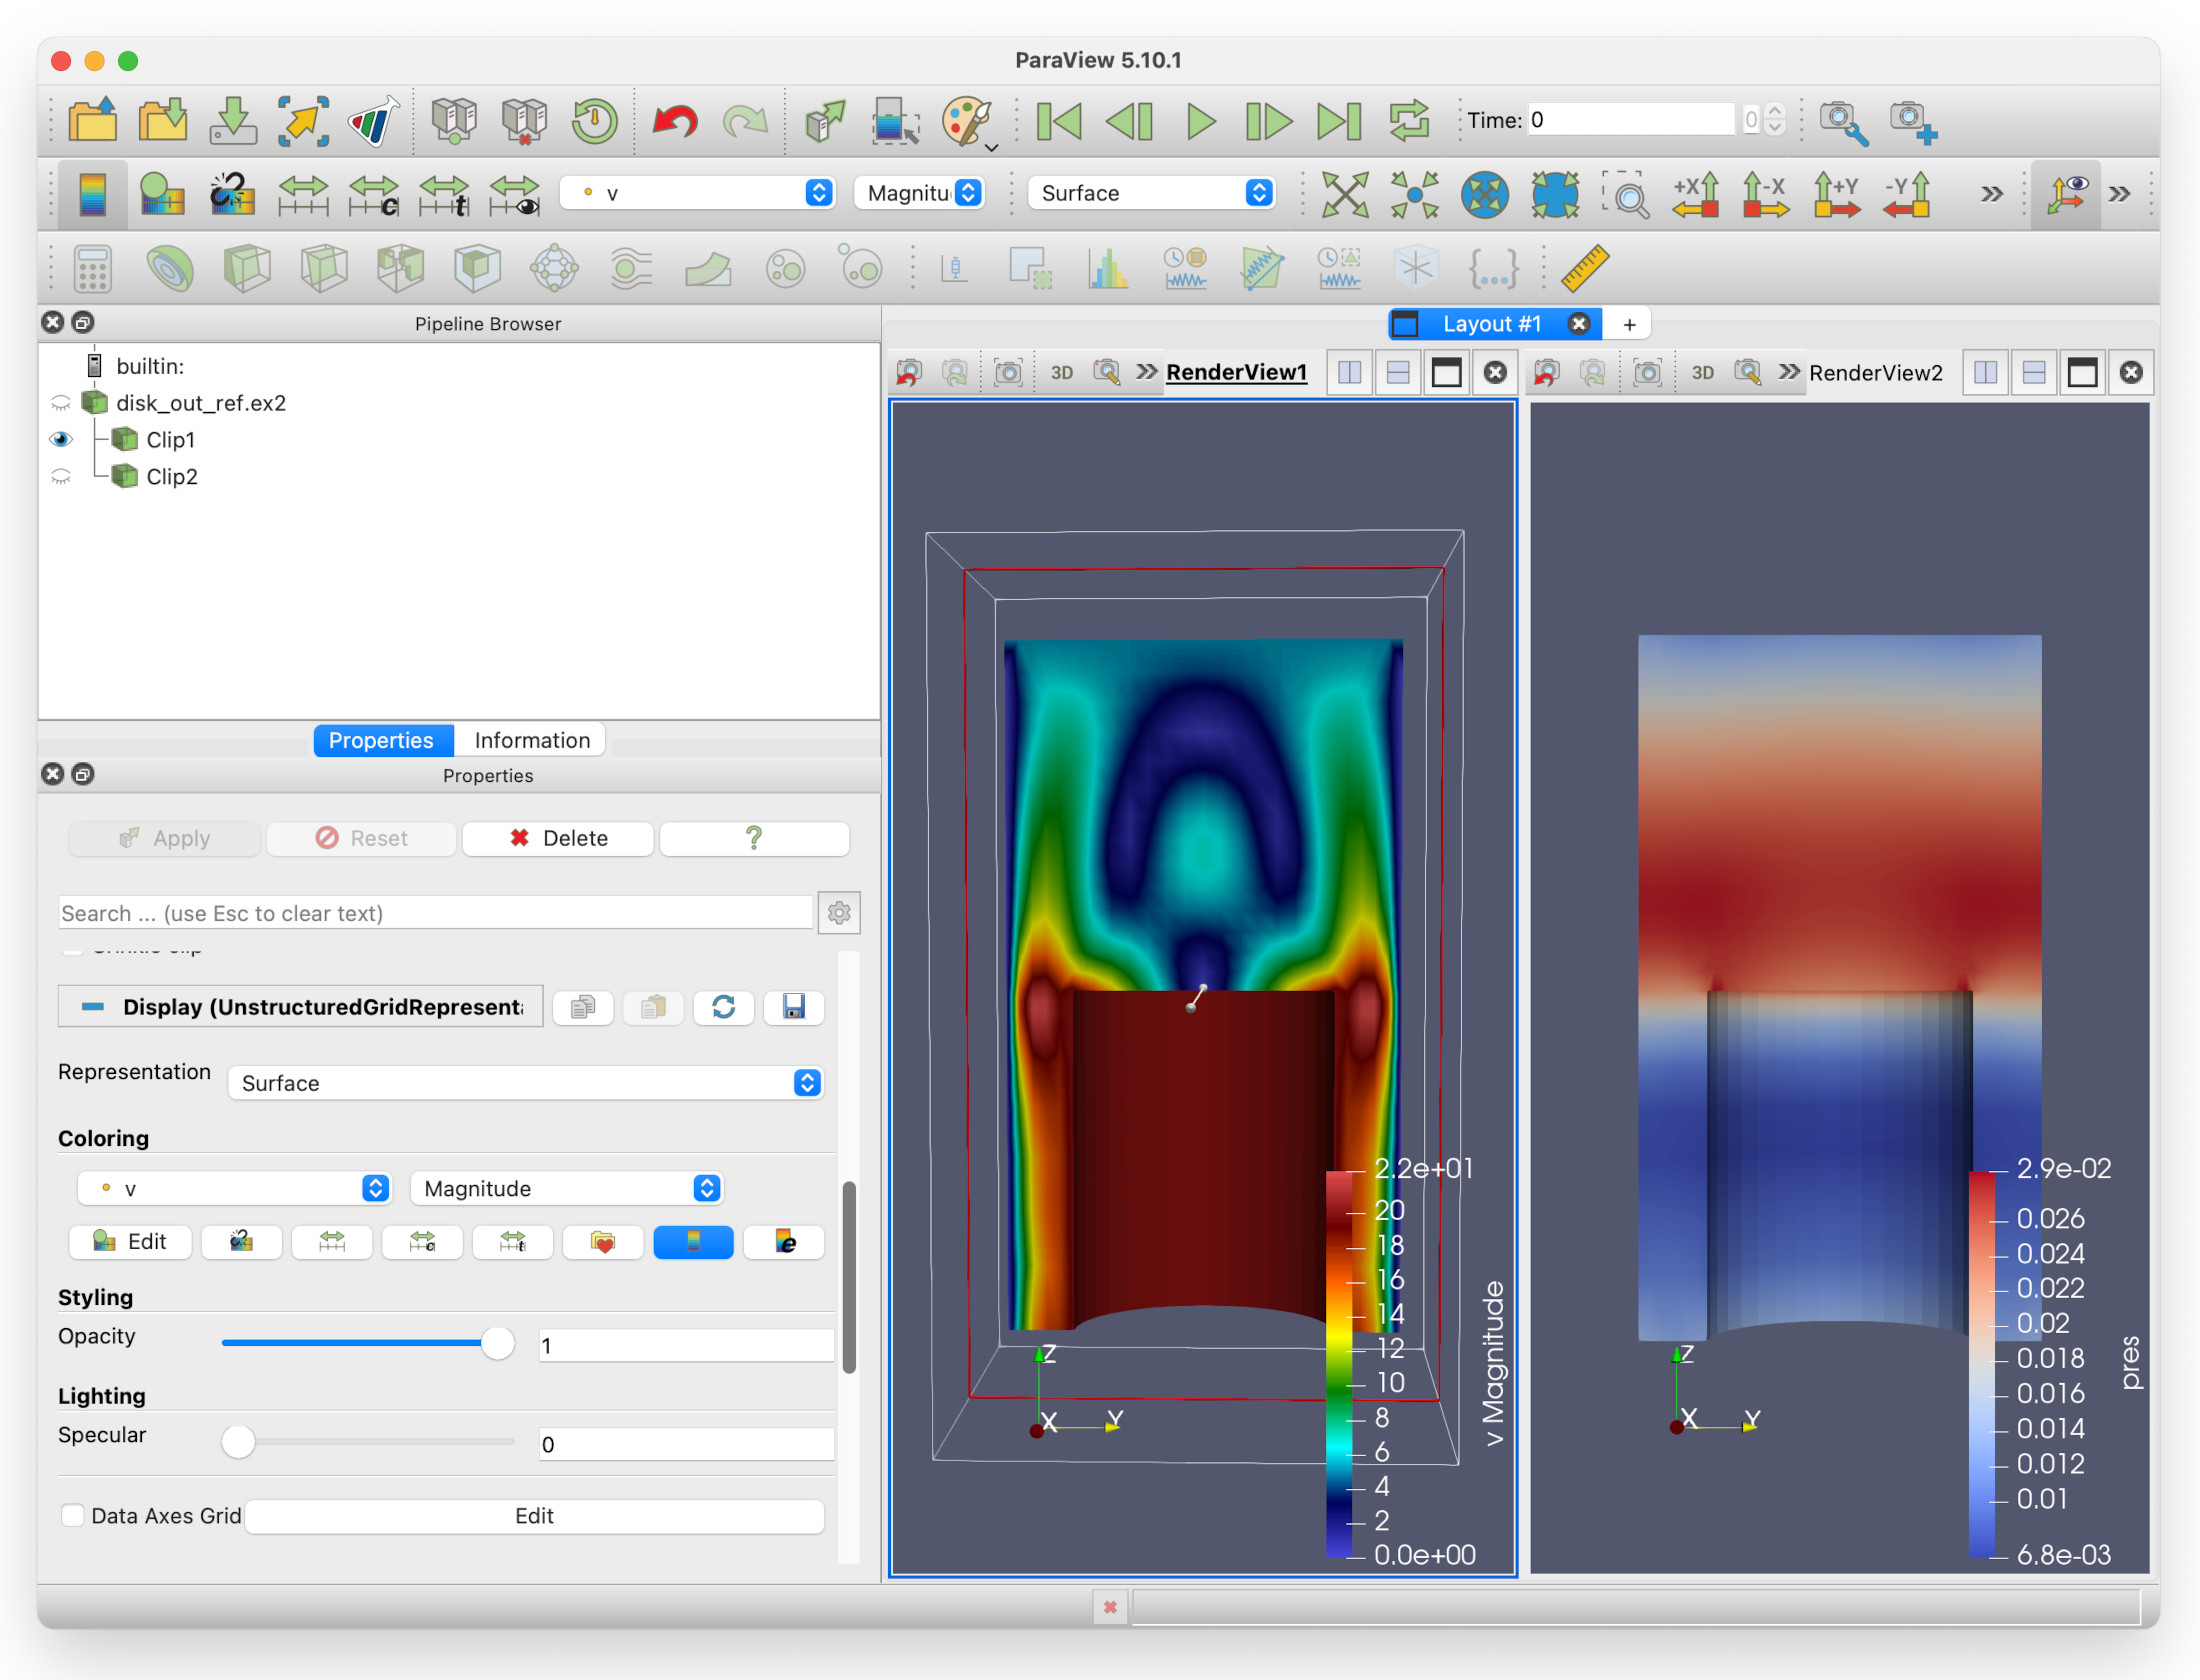
The second render view is empty: this is because both filters are displaying in RenderView1, none of them are in RenderView2. You can also see that all the eye icons in the Pipeline Browser are faded: this is because RenderView2 has been selected, but none of the filters are visible in that render view. If we click on the eye icon next to pressure, we should see that the pressure is now displayed in RenderView2, to the right of RenderView1.
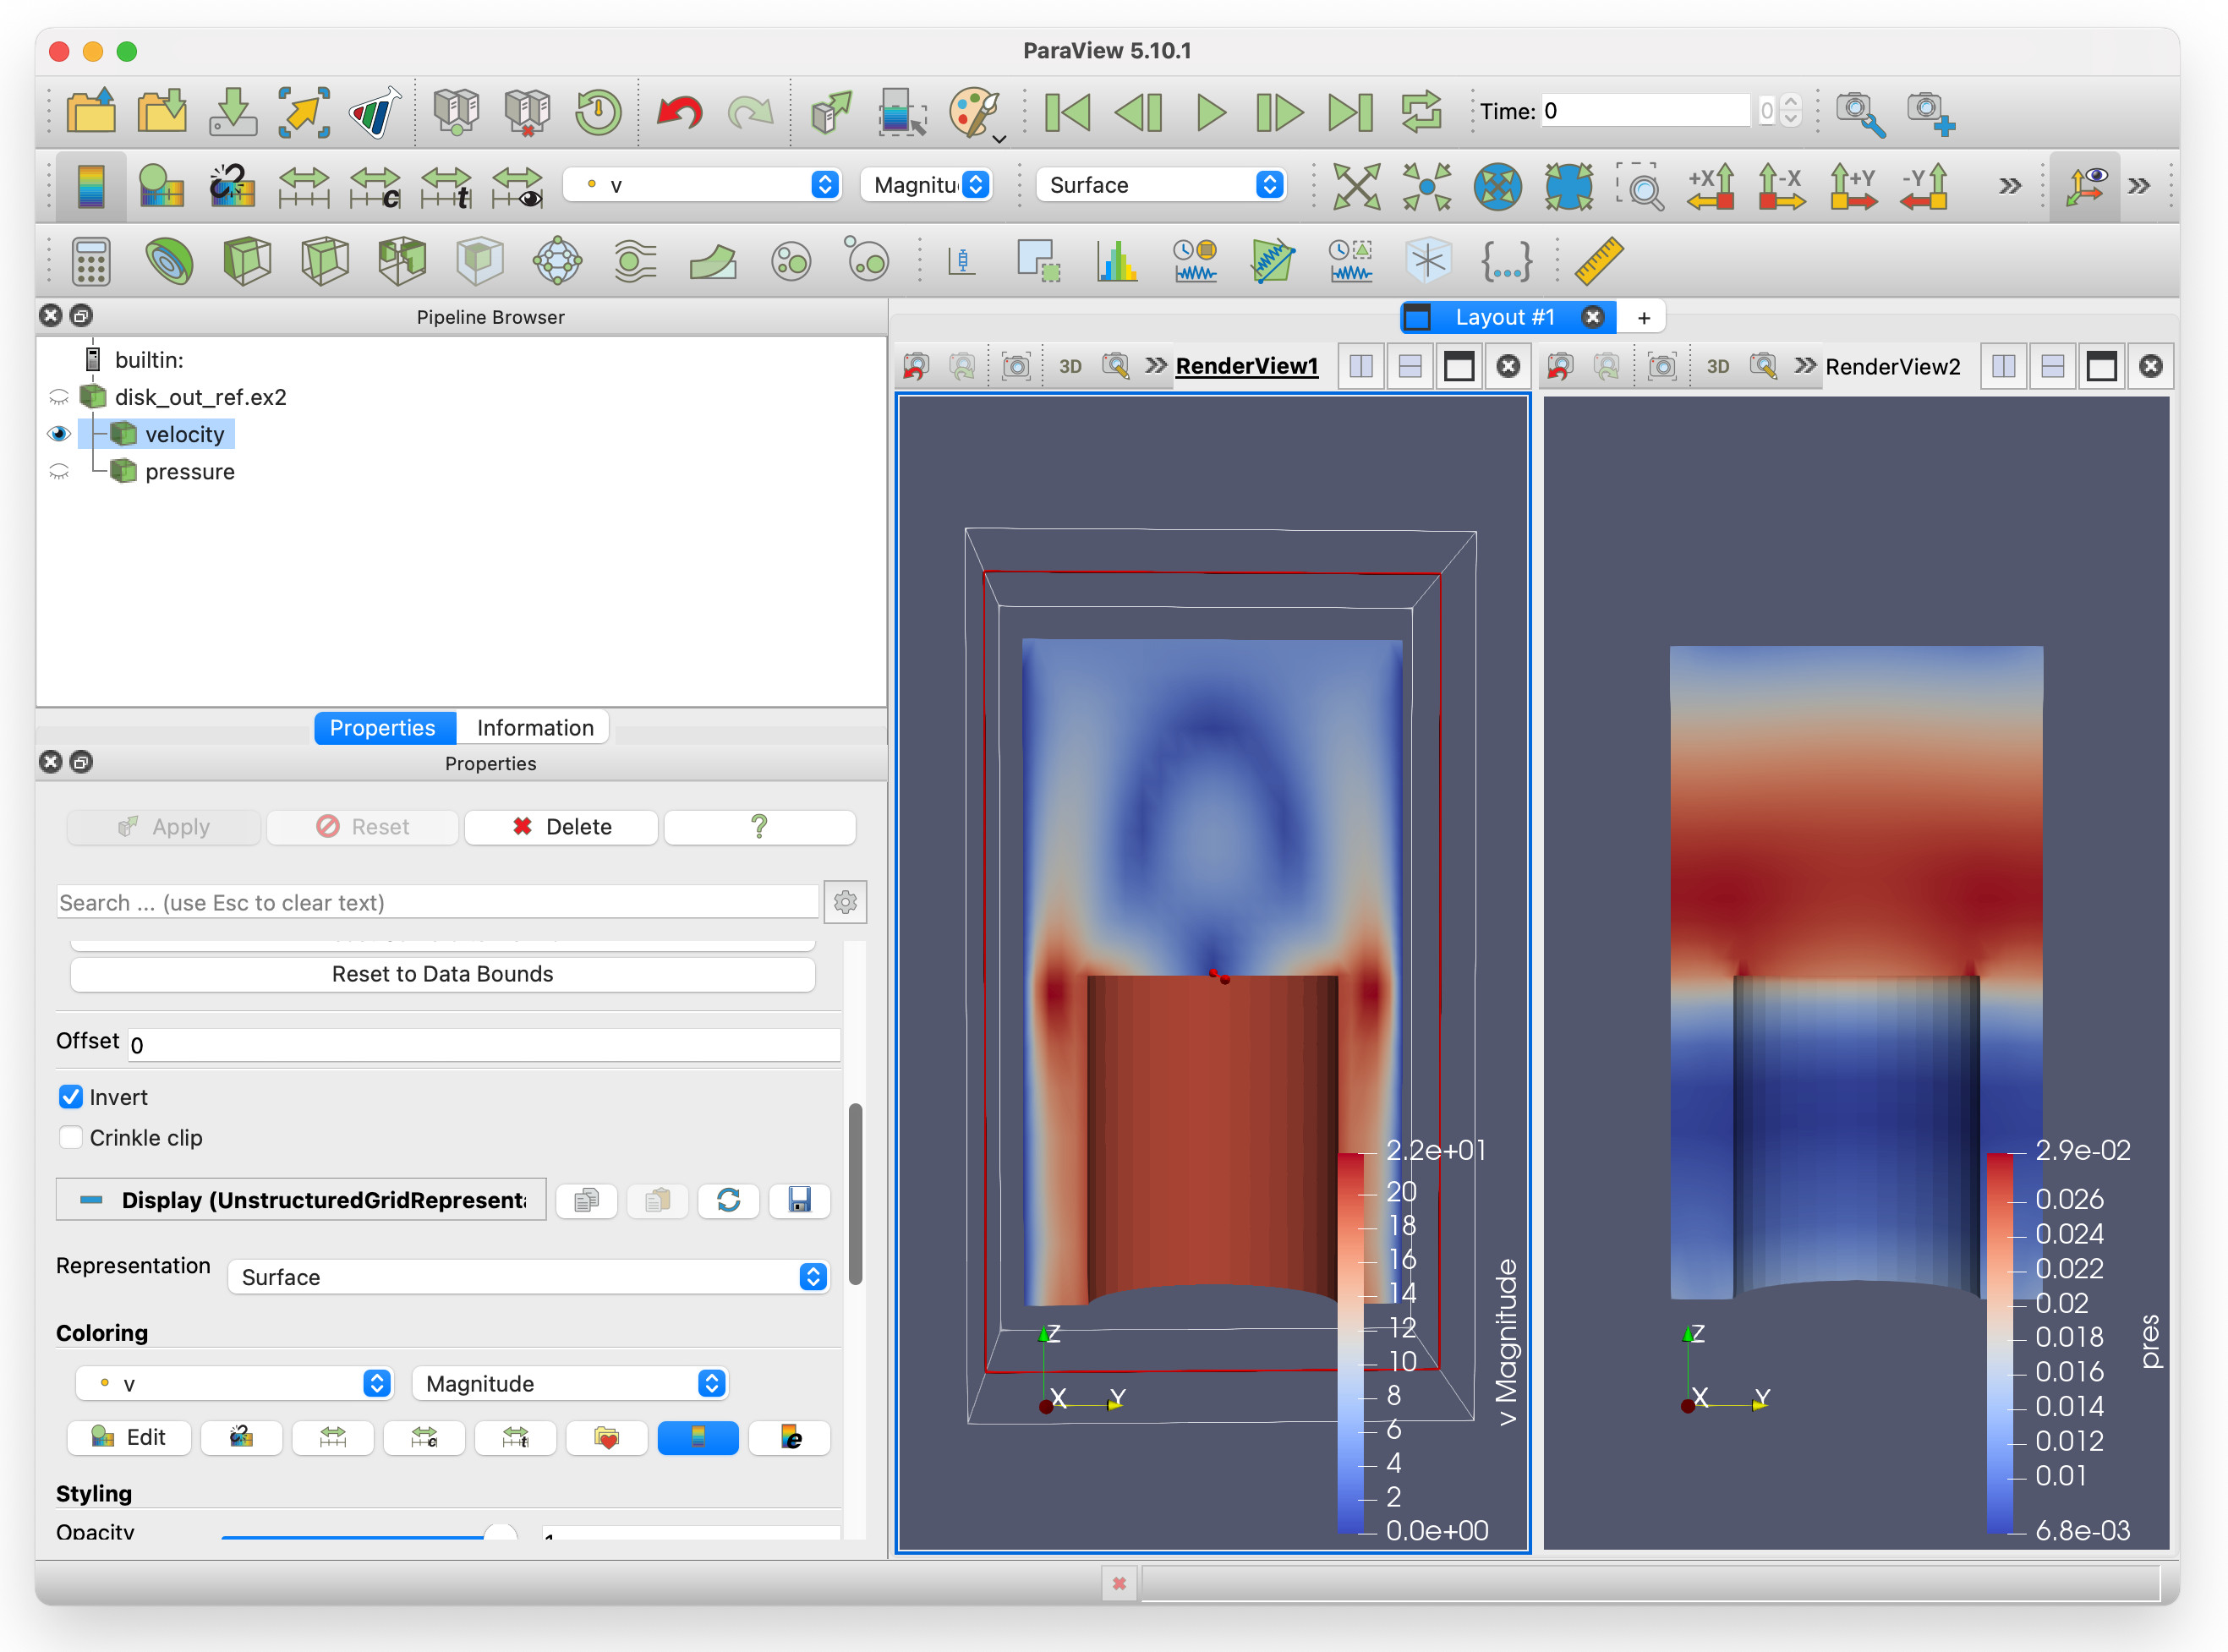
A note of caution here - each render view has its own viewing angle, viewing distance and field selection, so we will have to go through the steps we did for RenderView1:
- Press the -X axis button
- Change Solid Color in the colour selection toolbar menu to pres (pressure).
- (Optional) Zoom to the cylinder with the mouse scroll wheel.
Which gives you this view:
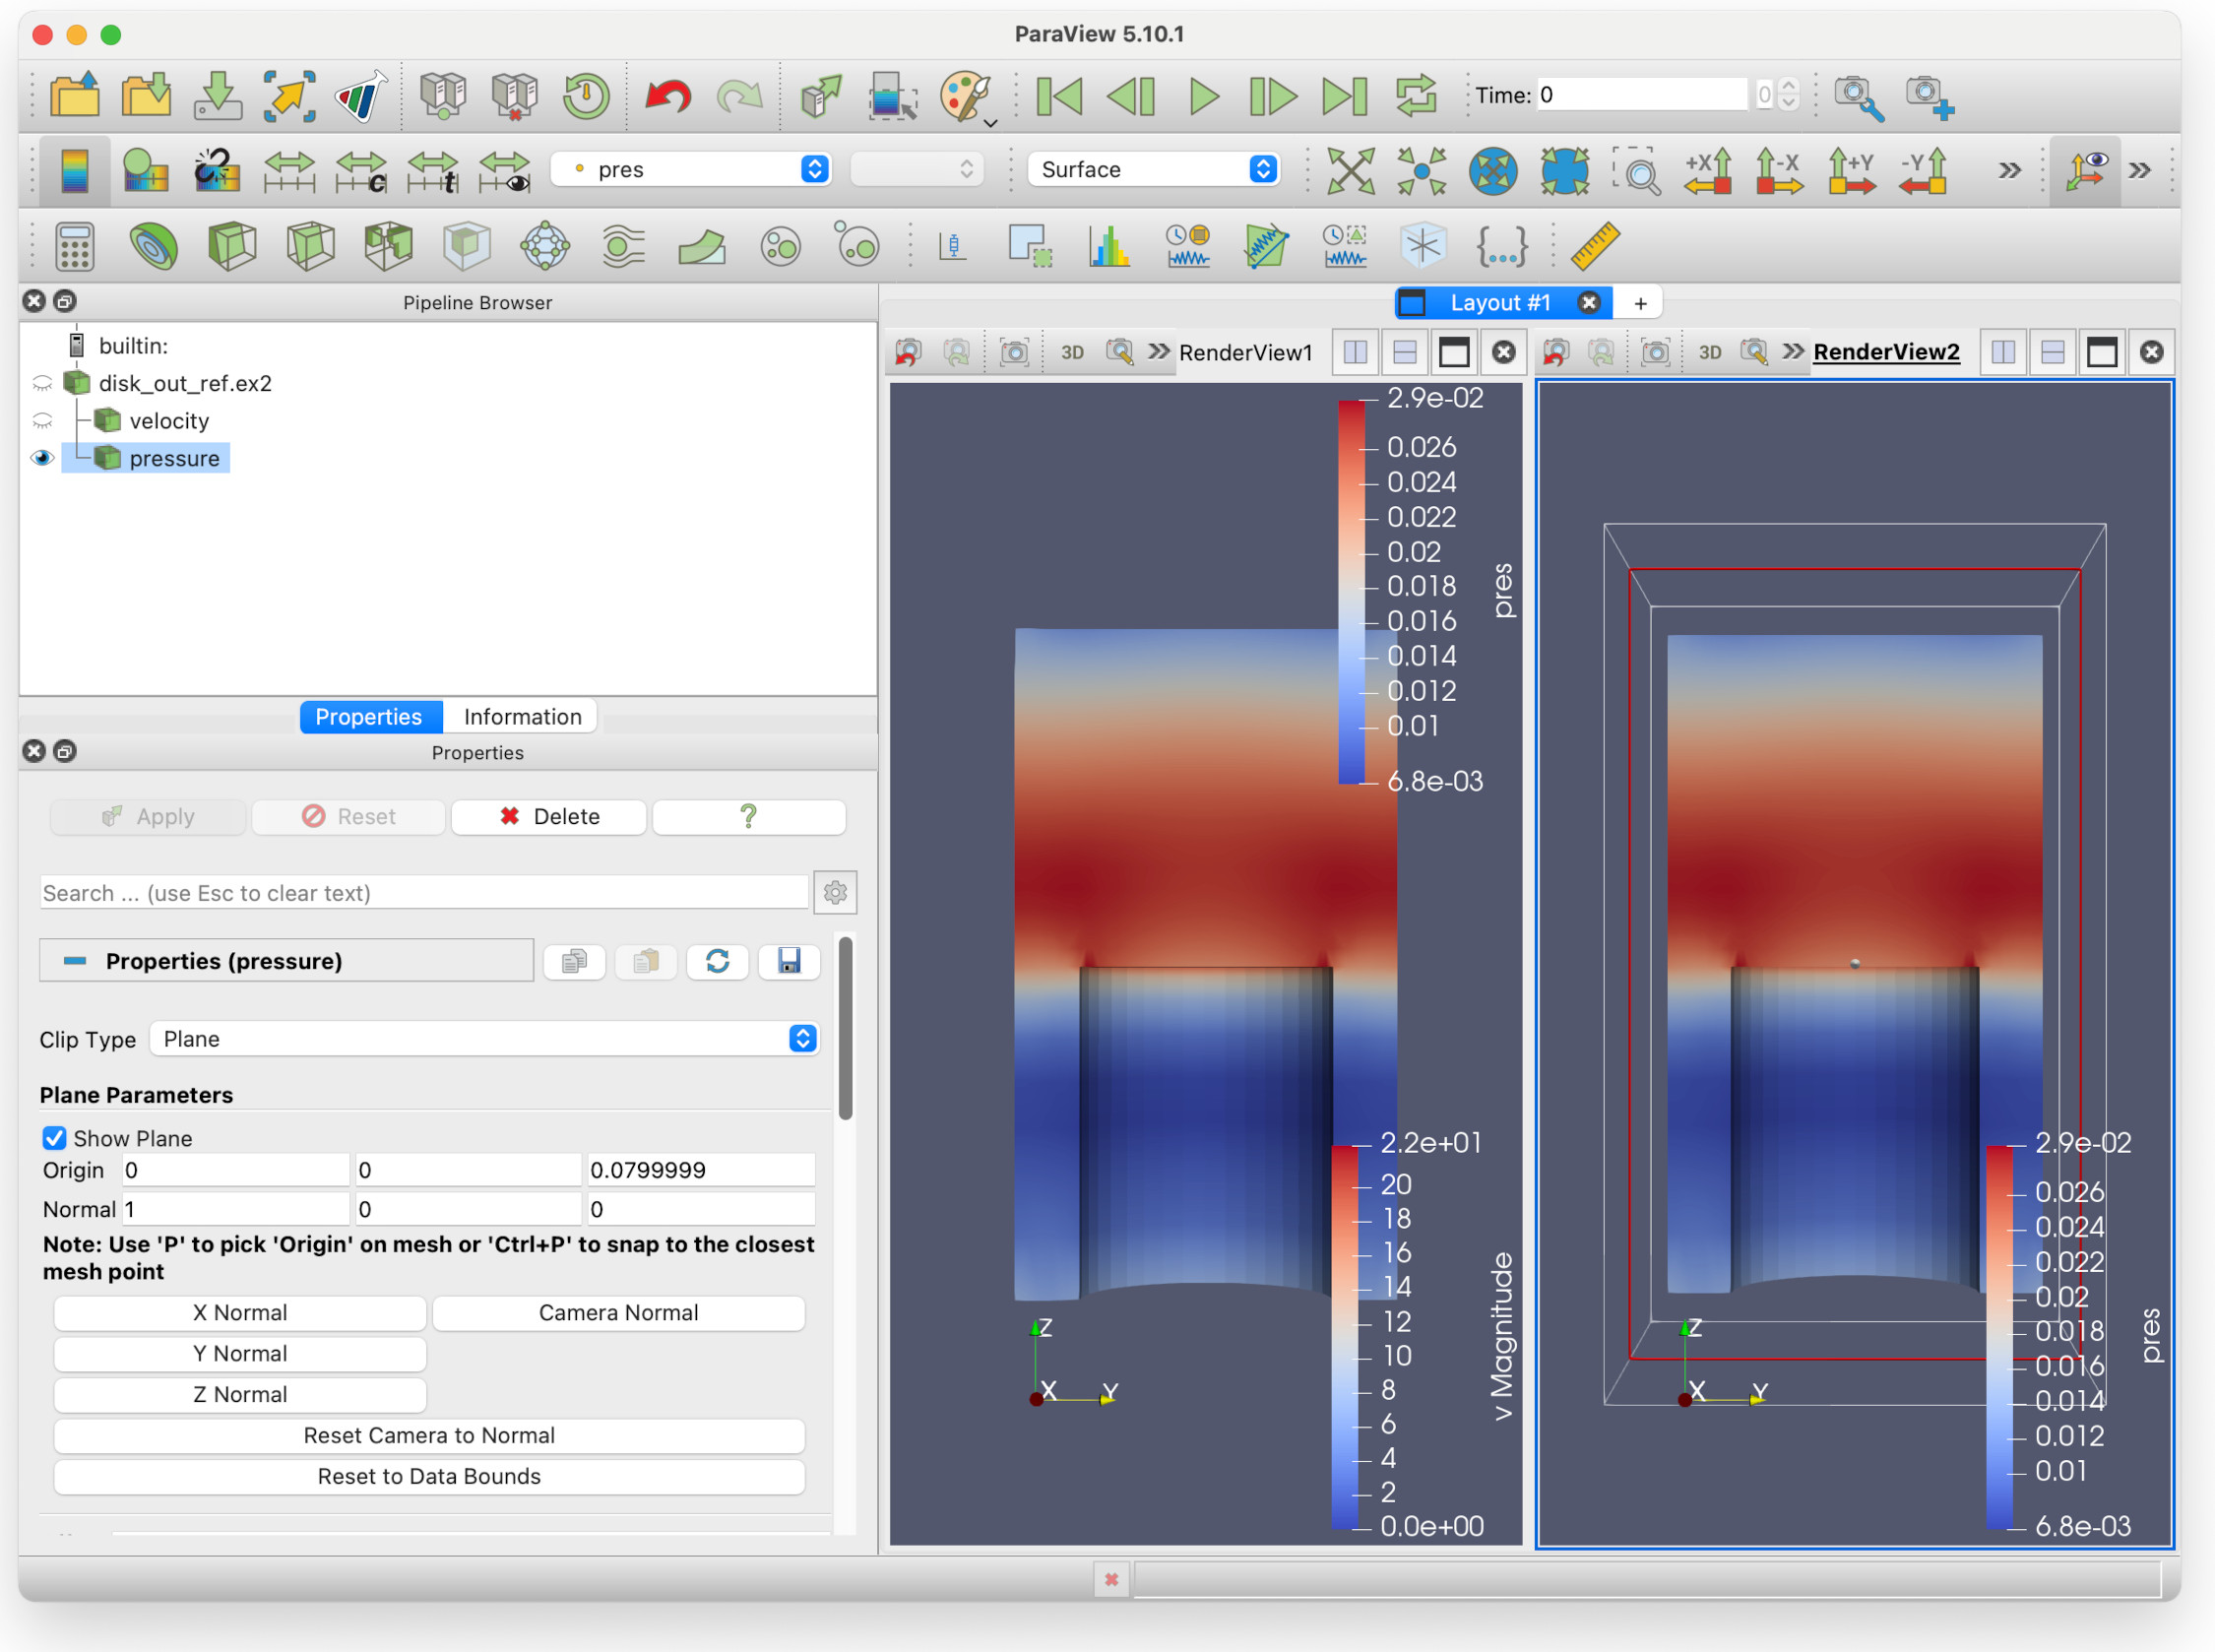
But hang on here - we are seeing two identical views of the pressure field! Surely something is wrong? No, not quite - this is just showing one of the key features of Paraview: multiple filters can be shown in multiple views at the same time, from different viewpoints if need be.
Remember we mentioned that we can select render views? Let’s try that now. Left click on empty space within RenderView1. There now be a thin dark blue rectangle around RenderView1 (which was previously around the second render view).
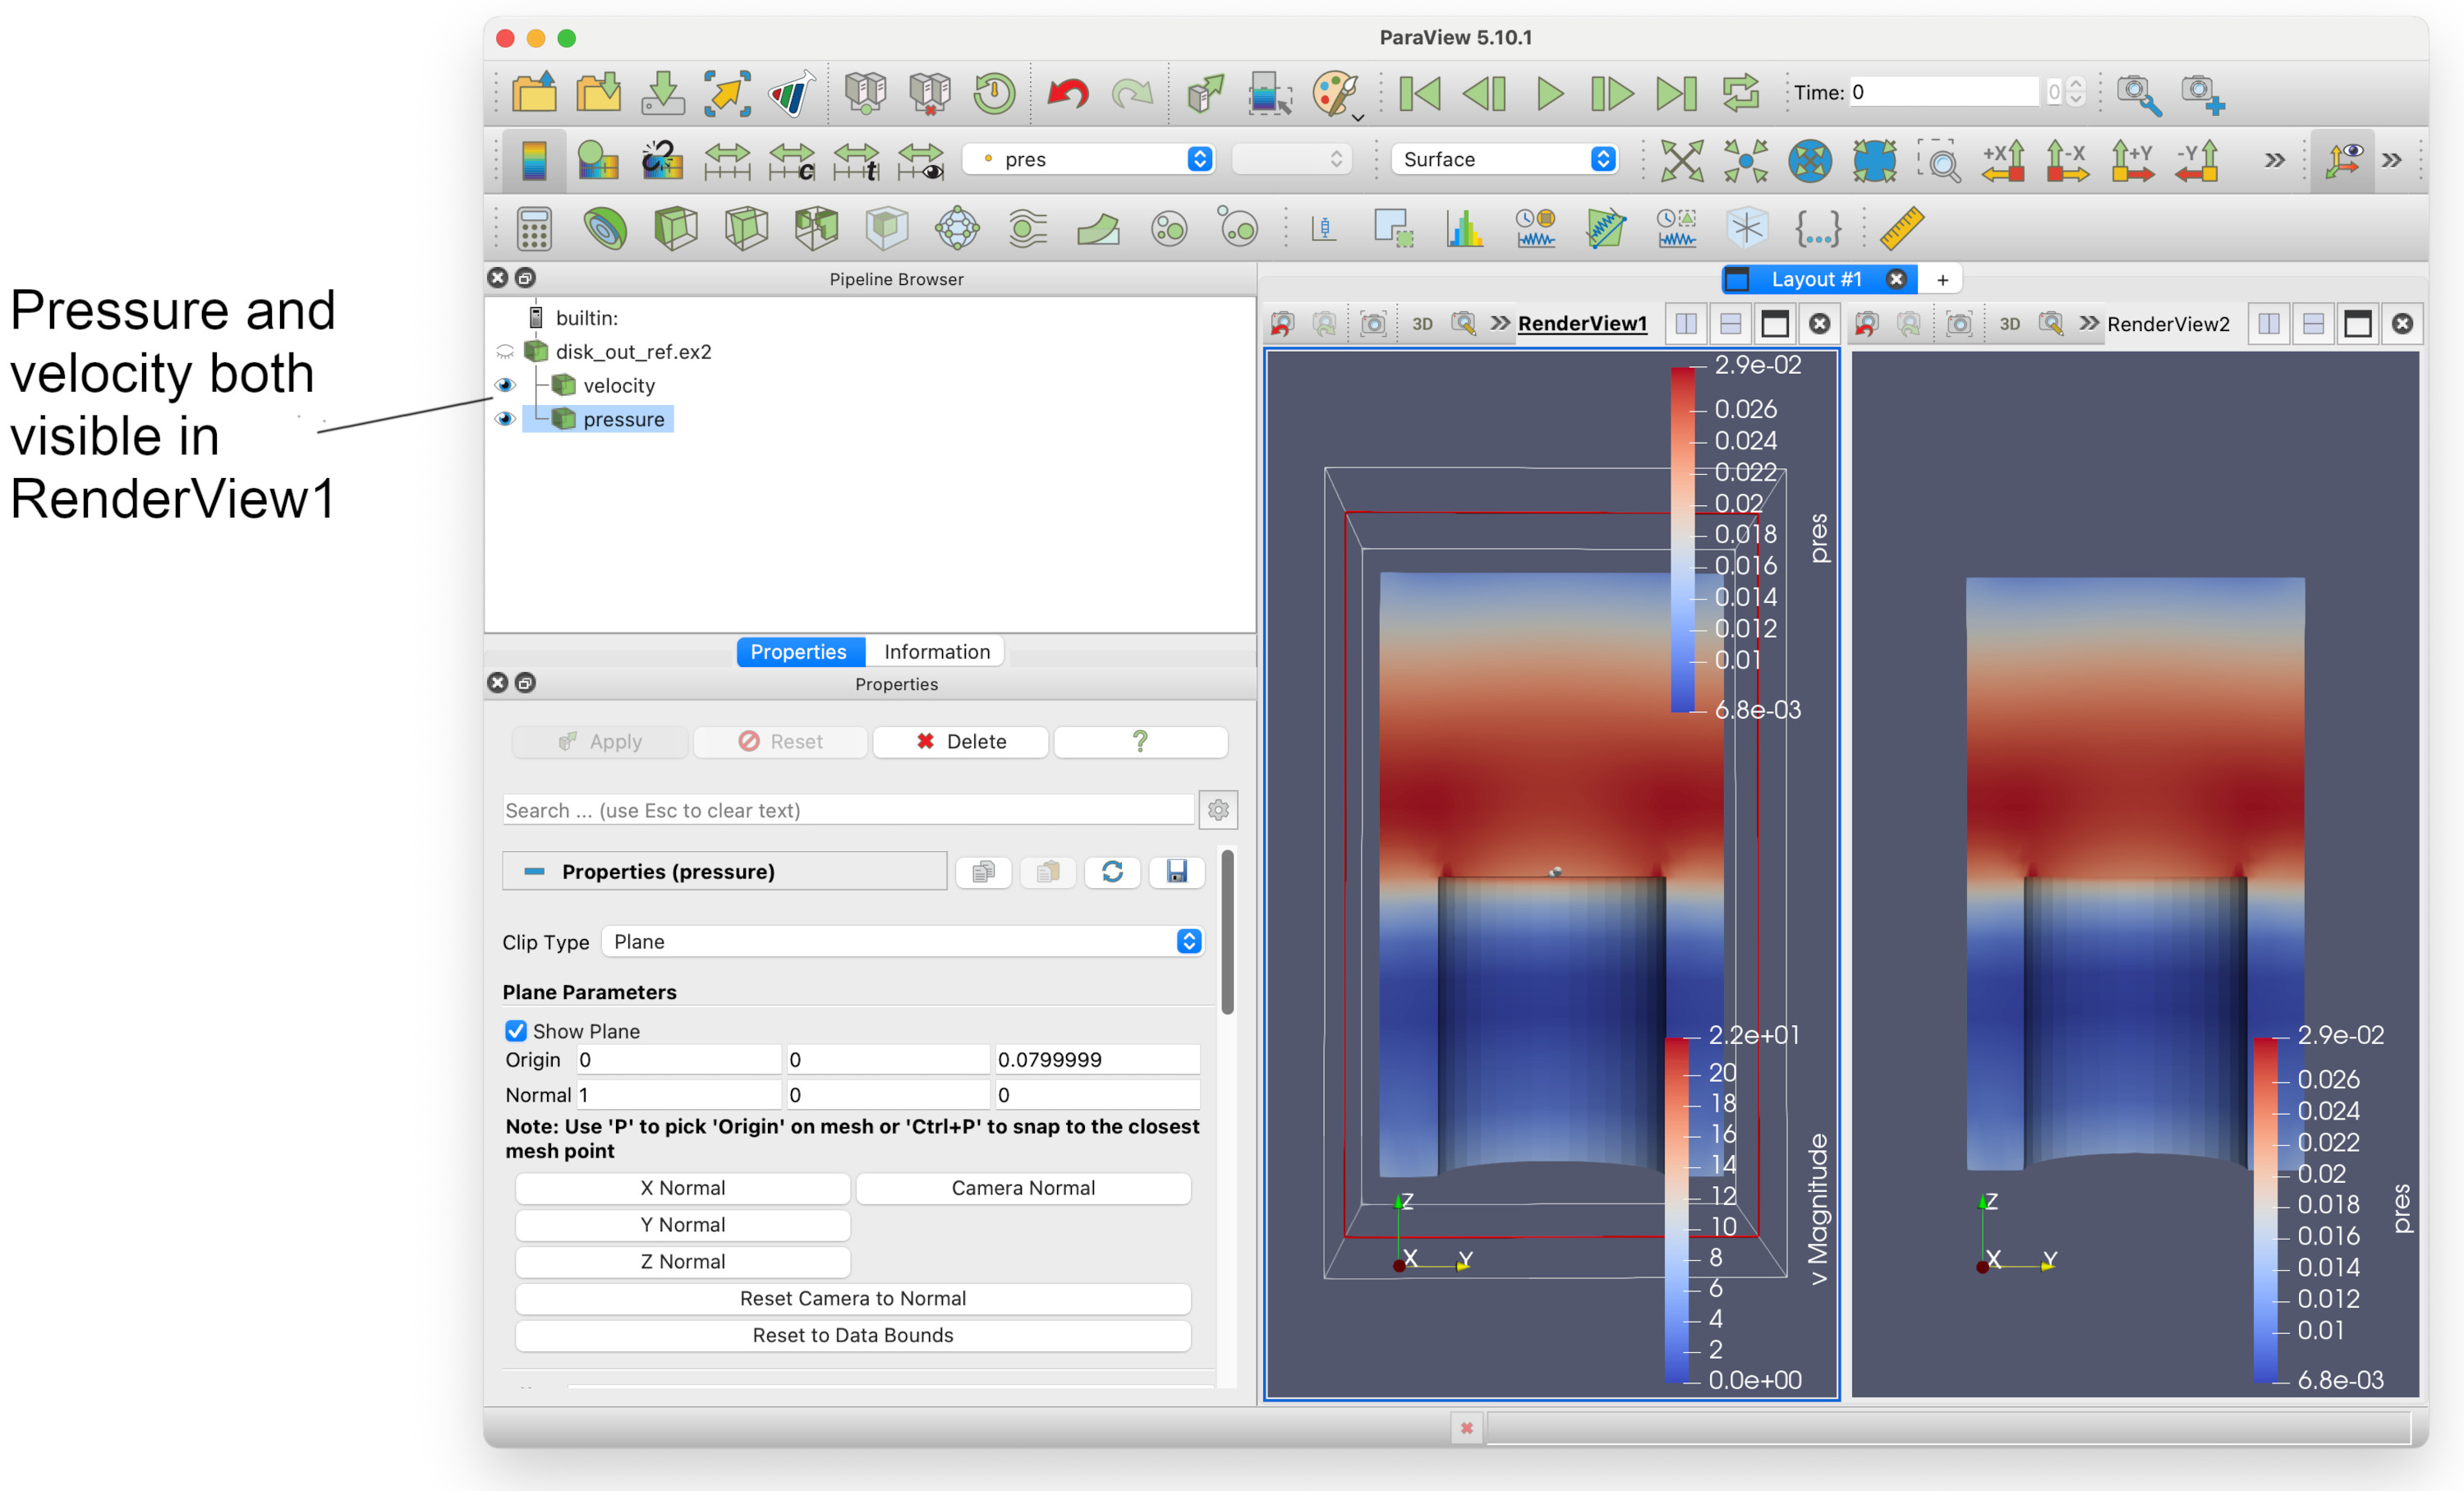
We can see that both velocity and pressure are visible in RenderView1. If we select the eye icon to the left of pressure, it should fade out. We can now have two render views, showing velocity and pressure side-by-side.
Changing the colourmap
Colourmaps (or colormaps!) tell Paraview how to colour the data according to the value. So if you have a temperature field with a colourmap defined to set be red at 30C, and blue at -30C, then warmer or colder temperatures will be coloured accordingly. Any values in between those ranges will have the colour interpolated between red and blue.
Colourmaps can be quite sophisticated, and you can even create your own. Paraview however has many good presets which you can use, and you may find giving different filters distinct colourmaps will make visualizations clearer. We will do that now.
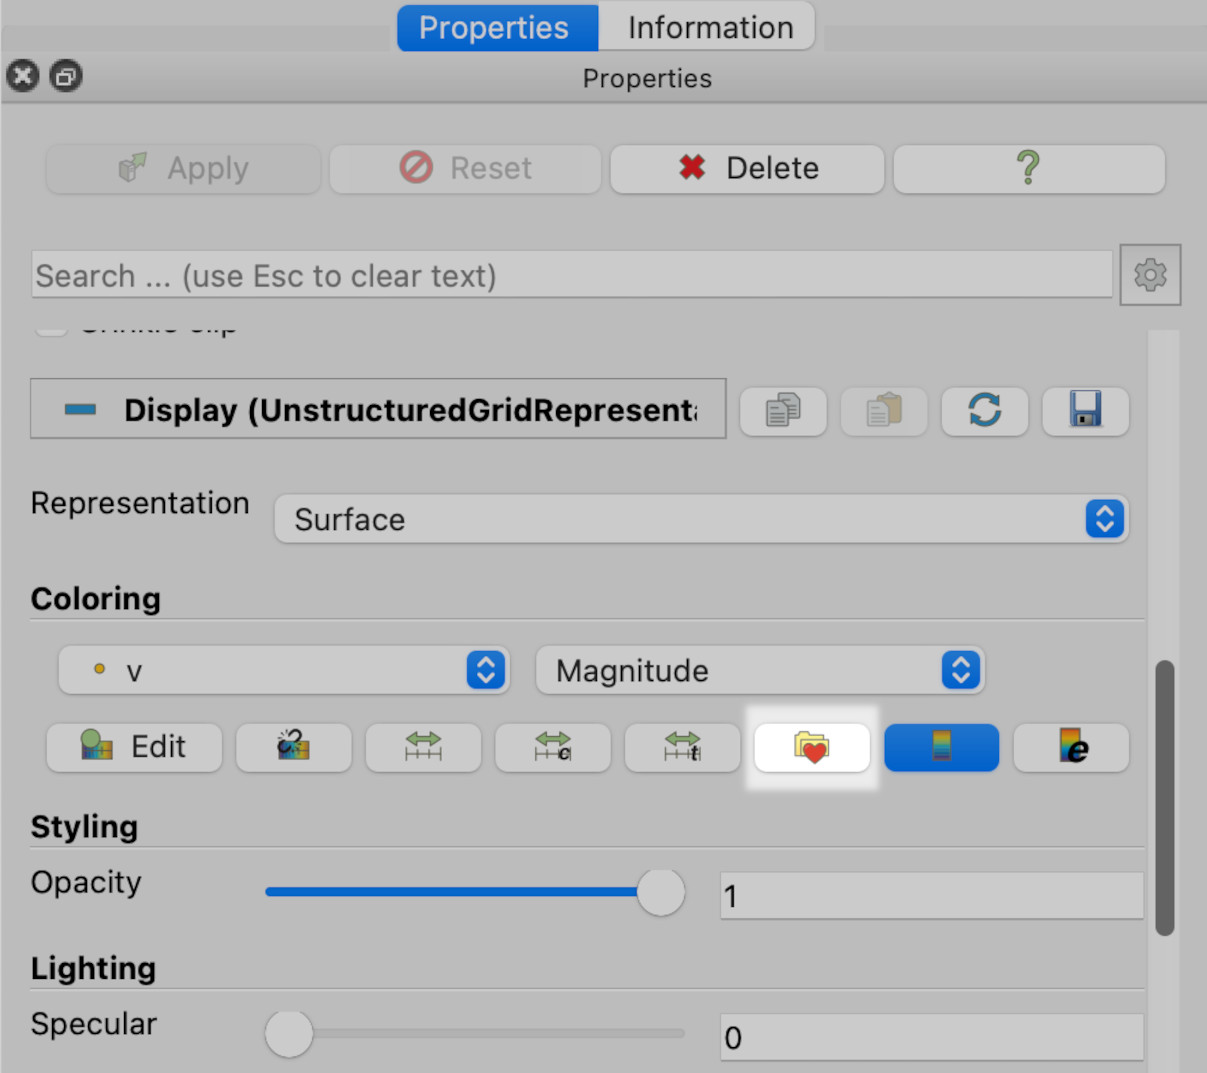
1. Click on the left render view (RenderView1). 2. Select Clip1 in the Pipeline browser. 3. Select Properties in the tabbed panes on the left. 4. Scroll down until you see the folder with the heart icon, and click on it.
This will give you the colourmap dialogue:
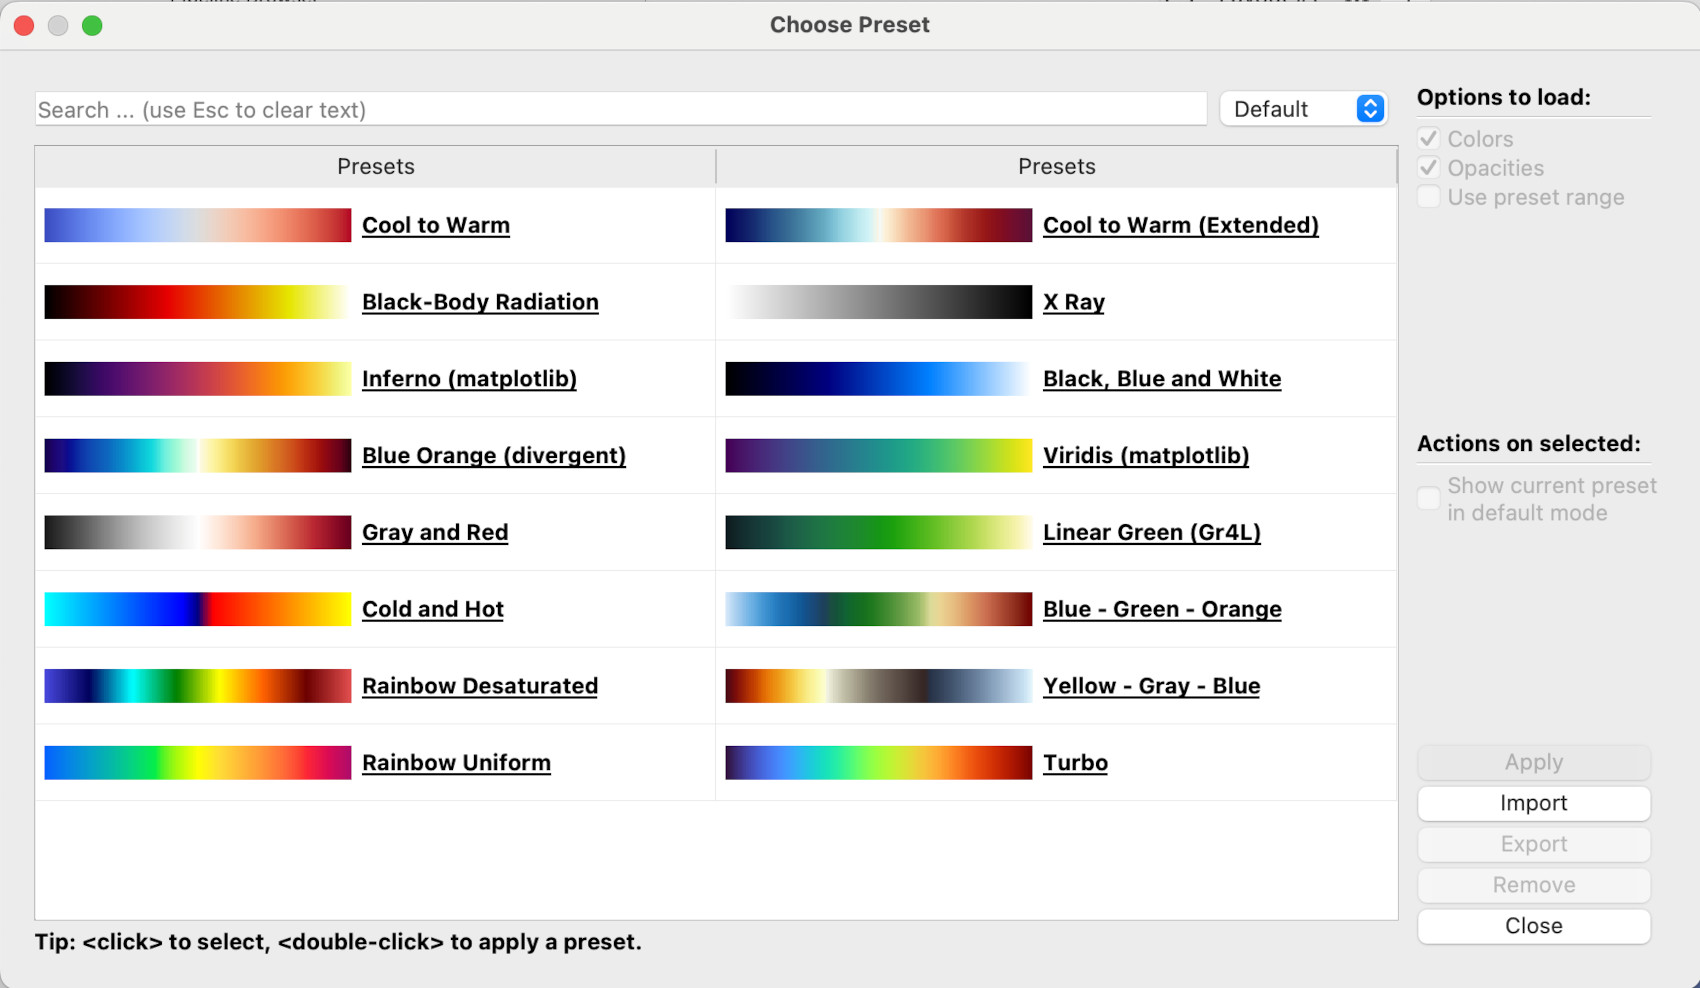
Here, the Rainbow Desaturated colourmap will be chosen, but of course you can pick any one. Note, the pull-down menu on the top-right where Default is currently selected. There are many, many more colourmaps available: if you select All instead of Default, the dialogue window will display every colourmap available.
5. Once you have chosen a colourmap, click Apply then Close. { start=5 }
You should now see that the colourmap for the velocity magnitude in RenderView1 has changed.
Key Points
Paraview can use filters to highlight specific aspects of the data
Multiple filters can be used on one set of data
Different views can be created to display different filters
Colourmaps tell Paraview how to colour data fields